이 설정은 각 Pod가 평균적으로 200 mill의 CPU를 사용할 때까지 Pod의 수를 늘립니다.
1.2.2. 사용자 정의 메트릭
HPA에서 사용자 정의 메트릭을 지원하는 것은 매우 중요합니다. 이를 통해 애플리케이션에 특화된 메트릭에 기반하여 자동 스케일링을 수행할 수 있습니다. 두 가지 주요 사용자 정의 메트릭 타입이 있습니다: Pod 메트릭과 Object 메트릭.
Pod 메트릭: 이는 각 Pod에 대한 메트릭을 설명합니다. 이 메트릭은 Pod 간의 평균을 내고, 그 평균값을 대상 값과 비교하여 레플리카 수를 조정합니다. 예를 들어, ‘packets-per-second’라는 메트릭이 있다면, 그 값을 특정 임계치와 비교하여 Pod의 수를 조절할 수 있습니다.
Object 메트릭: 오브젝트 메트릭을 이용해 HPA를 구성할 때, 특정 오브젝트(예: Ingress, Service 등)의 메트릭을 이용합니다. 이는 ‘Value’ 또는 ‘AverageValue’ target 타입을 지원하며, 이들은 각각 API에서 반환된 메트릭 값을 직접적으로 비교하거나, 메트릭 값을 Pod의 수로 나눈 값을 대상 값과 비교하는 방식으로 동작합니다.
예를 들어, “requests-per-second”라는 오브젝트 메트릭이 있다고 가정해보겠습니다. 이 메트릭은 Ingress 오브젝트 ‘main-route’에 연관되어 있지만, 이 메트릭 값은 실제로는 해당 Ingress 오브젝트에 도달하는 트래픽의 요청 수를 나타냅니다. 이런 값은 일반적으로 로드 밸런서나 인그레스 컨트롤러 같은 외부 시스템에서 모니터링하고 수집합니다.
코드에 메트릭이 설정된 대상 값이 2k라는 것은, 초당 2000개의 요청이 이 Ingress 오브젝트에 도달했을 때, HPA가 스케일링을 수행하도록 설정되어 있다는 것을 의미합니다.
이 설정은, Ingress ‘main-route’에 도달하는 트래픽이 많아지면, 자동으로 더 많은 Pod를 생성하여 트래픽을 처리하도록 하기 위한 것입니다.
HPA는 이 설정을 보고 Kubernetes API 또는 외부 메트릭 시스템으로부터 해당 메트릭의 현재 값을 가져옵니다. 가져온 현재 메트릭 값과 설정된 대상 값을 비교하고, 필요에 따라 Pod의 수를 증가 또는 감소 시킵니다.
HPA는 여러 메트릭 블록을 포함할 수 있으며, 이를 통해 여러 메트릭을 기반으로 스케일링 결정을 내릴 수 있습니다. HPA는 각 메트릭에 대해 제안된 레플리카 수를 계산하고, 그중 가장 높은 레플리카 수를 선택합니다. 이를 통해 다양한 메트릭을 종합적으로 고려하여 더욱 정교한 스케일링 결정을 내릴 수 있습니다.
Copy
# External type metrics
metrics:
- type: External
  external:
    metric:
      name: queue_messages_ready
      selector:
        matchLabels:
          queue: "worker_tasks"
    target:
      type: AverageValue
      averageValue: 30

# Object type metrics
metrics:
- type: Object
  object:
    describedObject:
      kind: Pod
      name: nginx-pod-xyz
      apiVersion: v1
    metric:
      name: nginx_http_requests_total
      selector: {}
      target:
        type: Value
        value: "1000"  # Scale when the total number of requests exceeds 1000
CRD처럼 커스텀 메트릭에 의해 HPA 동작 조건을 설정할 수 있습니다. message queue나 특정 상황의 아키텍처에서 서비스 개발을 할 때 고려해볼 만한 방식의 HPA 조건 설정입니다.
위에서 보는 것 처럼 hpa의 custome metrics block에서 type으로 object type을 사용할때 .metric.target.type으로 Value, AverageValue 두가지를 사용 할 수 있으며, 두개의 차이점은 아래와 같다.
Feature
Value
AverageValue
Metric Calculation
Compares the exact value of the metric for a single object (e.g., pod) to a specified target.
Compares the average value of the metric across multiple objects (e.g., pods) to a specified target.
Usage
Suitable when you want scaling based on a specific, absolute metric value for an individual pod or resource.
Suitable when you want scaling based on the average of the metric value across multiple pods or replicas.
Scaling Behavior
Triggers scaling based on the exact value of the metric (e.g., nginx_http_requests_total exceeding a specific count).
Triggers scaling based on the average value of the metric across all selected objects (e.g., average requests across all pods).
Example Scenario
Scale based on the total number of requests a pod handles.
Scale based on the average number of requests across all pods in the deployment.
Value:
AverageValue:
1.2.4. Behavior
autoscaling/v2 부터 (beta는 제외) behavior 필드라는것이 새로 생겼습니다. 스케일 업 동작 / 스케일 다운 동작을 별도로 구성할 수 있습니다. 우선 간단한 예제코드를 보면서 이해를 해보겠습니다.
periodSeconds 는 폴리시가 참(true)으로 유지되어야 하는 기간을 나타냅니다. 첫 번째는 (Pods)가 1분 내에 최대 4개의 Replicas를 스케일 다운할 수 있도록 허용하는 정책입니다. 두 번째는 현재 Replicas의 최대 10%를 1분 내에 스케일 다운할 수 있도록 허용하는 정책입니다.
실제로, prometheus-adapter를 설치하여 custom metric을 정의하고 해당 custom metric을 통해서 hpa의 autoscaling 기능을 활용해본다.
이 예제에서는 prometheus의 serviceMonitor 등록을 통해 nginx pod의 nginx_http_request_total을 수집하고, 해당 metric을 prometheus-adapter를 통해 custom.metrics.k8s.io(=custom metric)으로 등록하고, 해당 custom metric을 통해 hpa v2를 생성해 pod autoscaling이 정상적으로 진행되는지 확인한다. 정리해보자면 아래와 같다.
# 설치 전 기존 metrics-server 제공 Metris API 확인
kubectl get --raw "/apis/metrics.k8s.io" -v=6 | jq
kubectl get --raw "/apis/metrics.k8s.io" | jq
{
  "kind": "APIGroup",
  "apiVersion": "v1",
  "name": "metrics.k8s.io",
  ...


# KEDA 설치 : serviceMonitor 만으로도 충분할듯..
cat < keda-values.yaml
metricsServer:
  useHostNetwork: true

prometheus:
  metricServer:
    enabled: true
    port: 9022
    portName: metrics
    path: /metrics
    serviceMonitor:
      # Enables ServiceMonitor creation for the Prometheus Operator
      enabled: true
    podMonitor:
      # Enables PodMonitor creation for the Prometheus Operator
      enabled: true
  operator:
    enabled: true
    port: 8080
    serviceMonitor:
      # Enables ServiceMonitor creation for the Prometheus Operator
      enabled: true
    podMonitor:
      # Enables PodMonitor creation for the Prometheus Operator
      enabled: true
  webhooks:
    enabled: true
    port: 8020
    serviceMonitor:
      # Enables ServiceMonitor creation for the Prometheus webhooks
      enabled: true
EOT

helm repo add kedacore https://kedacore.github.io/charts
helm repo update
helm install keda kedacore/keda --version 2.16.0 --namespace keda --create-namespace -f keda-values.yaml

# KEDA 설치 확인
kubectl get crd | grep keda
kubectl get all -n keda
kubectl get validatingwebhookconfigurations keda-admission -o yaml
kubectl get podmonitor,servicemonitors -n keda
kubectl get apiservice v1beta1.external.metrics.k8s.io -o yaml

# CPU/Mem은 기존 metrics-server 의존하여, KEDA metrics-server는 외부 이벤트 소스(Scaler) 메트릭을 노출
## https://keda.sh/docs/2.16/operate/metrics-server/
kubectl get pod -n keda -l app=keda-operator-metrics-apiserver

# Querying metrics exposed by KEDA Metrics Server
kubectl get --raw "/apis/external.metrics.k8s.io/v1beta1" | jq
{
  "kind": "APIResourceList",
  "apiVersion": "v1",
  "groupVersion": "external.metrics.k8s.io/v1beta1",
  "resources": [
    {
      "name": "externalmetrics",
      "singularName": "",
      "namespaced": true,
      "kind": "ExternalMetricValueList",
      "verbs": [
        "get"
      ]
    }
  ]
}

# keda 네임스페이스에 디플로이먼트 생성
kubectl apply -f php-apache.yaml -n keda
kubectl get pod -n keda

# ScaledObject 정책 생성 : cron
cat < keda-cron.yaml
apiVersion: keda.sh/v1alpha1
kind: ScaledObject
metadata:
  name: php-apache-cron-scaled
spec:
  minReplicaCount: 0
  maxReplicaCount: 2  # Specifies the maximum number of replicas to scale up to (defaults to 100).
  pollingInterval: 30  # Specifies how often KEDA should check for scaling events
  cooldownPeriod: 300  # Specifies the cool-down period in seconds after a scaling event
  scaleTargetRef:  # Identifies the Kubernetes deployment or other resource that should be scaled.
    apiVersion: apps/v1
    kind: Deployment
    name: php-apache
  triggers:  # Defines the specific configuration for your chosen scaler, including any required parameters or settings
  - type: cron
    metadata:
      timezone: Asia/Seoul
      start: 00,15,30,45 * * * *
      end: 05,20,35,50 * * * *
      desiredReplicas: "1"
EOT
kubectl apply -f keda-cron.yaml -n keda

# 그라파나 대시보드 추가 : 대시보드 상단에 namespace : keda 로 변경하기!
# KEDA 대시보드 Import : https://github.com/kedacore/keda/blob/main/config/grafana/keda-dashboard.json

# 모니터링
watch -d 'kubectl get ScaledObject,hpa,pod -n keda'
kubectl get ScaledObject -w

# 확인
kubectl get ScaledObject,hpa,pod -n keda

NAME                                          SCALETARGETKIND      SCALETARGETNAME   MIN   MAX   READY   ACTIVE   FALLBACK   PAUSED    TRIGGERS   AUTHENTICATIONS   AGE
scaledobject.keda.sh/php-apache-cron-scaled   apps/v1.Deployment   php-apache        0     2     True    True     False      Unknown                                22m

## 여기서 keda의 cron triggers를 통해서 생성된 hpa는 current 값을 계산 할 수 없으므로 unkonwn으로 표시된다.
NAME                                                                  REFERENCE               TARGETS             MINPODS   MAXPODS   REPLICAS   AGE
horizontalpodautoscaler.autoscaling/keda-hpa-php-apache-cron-scaled   Deployment/php-apache   /1 (avg)   1         2         0          22m

NAME                                                   READY   STATUS    RESTARTS       AGE
pod/keda-admission-webhooks-86cffccbf5-wp46z           1/1     Running   0              102m
pod/keda-operator-6bdffdc78-5tc4r                      1/1     Running   1 (102m ago)   102m
pod/keda-operator-metrics-apiserver-74d844d769-fdt82   1/1     Running   0              102m
pod/php-apache-d87b7ff46-6v7fq                         1/1     Running   0              27s


kubectl get hpa -o jsonpath="{.items[0].spec}" -n keda | jq
...
"metrics": [
    {
      "external": {
        "metric": {
          "name": "s0-cron-Asia-Seoul-00,15,30,45xxxx-05,20,35,50xxxx",
          "selector": {
            "matchLabels": {
              "scaledobject.keda.sh/name": "php-apache-cron-scaled"
            }
          }
        },
        "target": {
          "averageValue": "1",
          "type": "AverageValue"
        }
      },
      "type": "External"
    }

# KEDA 및 deployment 등 삭제
kubectl delete ScaledObject -n keda php-apache-cron-scaled && kubectl delete deploy php-apache -n keda && helm uninstall keda -n keda
kubectl delete namespace keda
ScaledObject cron type triggers에서 hpa가 unkonwn인 이유는?
[도전과제2] KEDA 활용 : Karpenter + KEDA로 특정 시간에 AutoScaling - 링크 , Youtube , Airflow , Blog
# [운영서버 EC2] 코드 다운로드
git clone https://github.com/kubernetes/autoscaler.git # userdata 로 설치 되어 있음
cd ~/autoscaler/vertical-pod-autoscaler/
tree hack

# openssl 버전 확인
openssl version
OpenSSL 1.0.2k-fips  26 Jan 2017

# 1.0 제거
yum remove openssl -y

# openssl 1.1.1 이상 버전 확인
yum install openssl11 -y
openssl11 version
OpenSSL 1.1.1g FIPS  21 Apr 2020

# 스크립트파일내에 openssl11 수정
sed -i 's/openssl/openssl11/g' ~/autoscaler/vertical-pod-autoscaler/pkg/admission-controller/gencerts.sh
git status
git config --global user.email "you@example.com"
git config --global user.name "Your Name"
git add .
git commit -m "openssl version modify"

# Deploy the Vertical Pod Autoscaler to your cluster with the following command.
watch -d kubectl get pod -n kube-system
cat hack/vpa-up.sh
./hack/vpa-up.sh

# VPA가 정상적으로 설치되지 않으면 재실행!
sed -i 's/openssl/openssl11/g' ~/autoscaler/vertical-pod-autoscaler/pkg/admission-controller/gencerts.sh
./hack/vpa-up.sh

kubectl get crd | grep autoscaling
kubectl get mutatingwebhookconfigurations vpa-webhook-config
kubectl get mutatingwebhookconfigurations vpa-webhook-config -o json | jq
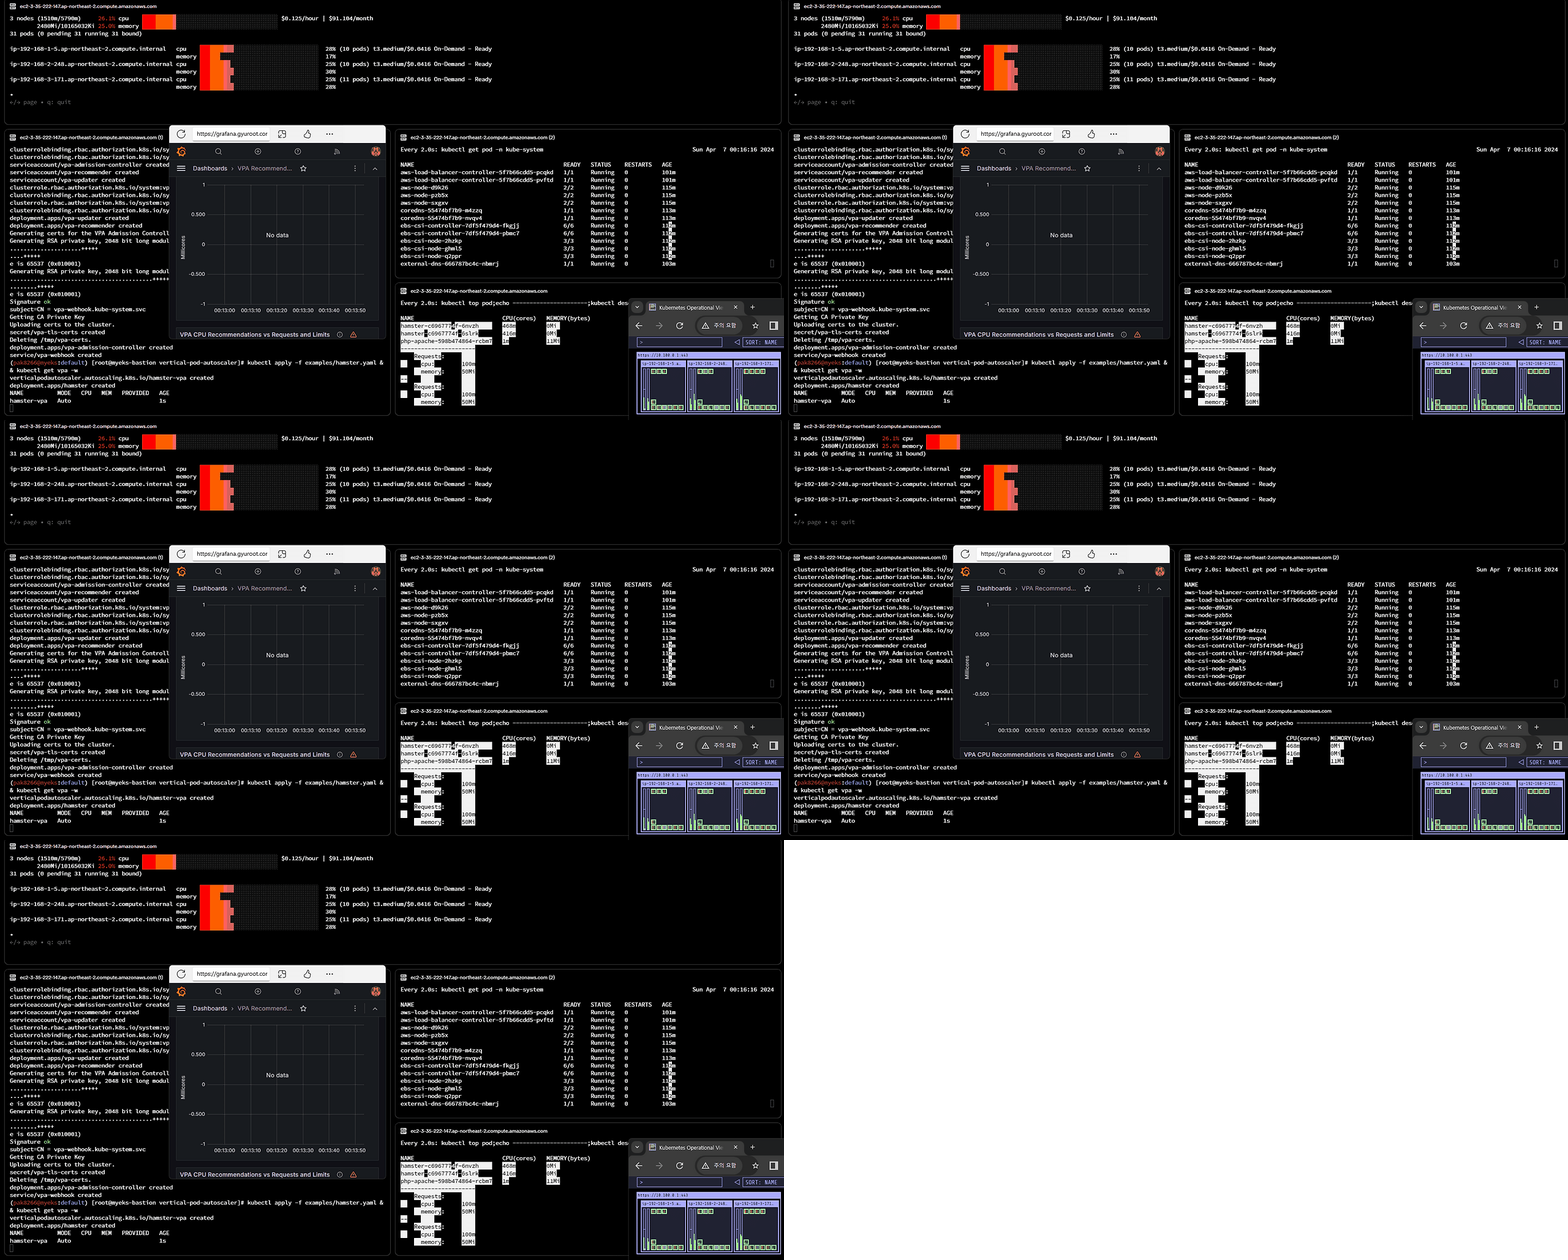
공식 예제 : pod가 실행되면 약 2~3분 뒤에 pod resource.reqeust가 VPA에 의해 수정 - 링크
Copy
# 모니터링
Every 2.0s: kubectl top pod;echo ----------------------;kubectl describe pod | grep Requests: -A2                                                                          Sat Mar  8 00:09:54 2025

NAME                         CPU(cores)   MEMORY(bytes)
hamster-598b78f579-hmc7b     409m         0Mi
hamster-598b78f579-m75h4     408m         0Mi
php-apache-d87b7ff46-x9ztz   1m           8Mi
----------------------
    Requests:
      cpu:        476m # vpa에 새롭게 생성된 hamster pod
      memory:     262144k
--
    Requests:
      cpu:        100m # 기존 hamster pod
      memory:     50Mi
--
    Requests:
      cpu:        476m # vpa에 새롭게 생성된 hamster pod
      memory:     262144k
--
    Requests:
      cpu:        200m
    Environment:  <none>


verticalpodautoscaler.autoscaling.k8s.io/hamster-vpa created
deployment.apps/hamster created
NAME          MODE   CPU   MEM   PROVIDED   AGE
hamster-vpa                                 1s
hamster-vpa          476m   262144k   True       31s

# 공식 예제 배포
cd ~/autoscaler/vertical-pod-autoscaler/
cat examples/hamster.yaml
kubectl apply -f examples/hamster.yaml && kubectl get vpa -w

# 파드 리소스 Requestes 확인
kubectl describe pod | grep Requests: -A2
    Requests:
      cpu:        100m
      memory:     50Mi
--
    Requests:
      cpu:        587m
      memory:     262144k
--
    Requests:
      cpu:        587m
      memory:     262144k

# VPA에 의해 기존 파드 삭제되고 신규 파드가 생성됨
kubectl get events --sort-by=".metadata.creationTimestamp" | grep VPA

37s         Normal   EvictedByVPA        pod/hamster-598b78f579-pggcg        Pod was evicted by VPA Updater to apply resource recommendation.
37s         Normal   EvictedPod          verticalpodautoscaler/hamster-vpa   VPA Updater evicted Pod hamster-598b78f579-pggcg to apply resource recommendation.
삭제: kubectl delete -f examples/hamster.yaml && cd ~/autoscaler/vertical-pod-autoscaler/ && ./hack/vpa-down.sh
3.3. KRR : Prometheus-based Kubernetes Resource Recommendations - 링크 & Youtube - 링크 ⇒ Krr을 통한 최적화 작업 경험 - Blog
KRR(Kubernetes Resource Recommender)을 사용하면 실제 사용량 기준으로 Request와 Limit 사용량을 추천
Cluster Autoscaler for AWS provides integration with Auto Scaling groups. It enables users to choose from four different options of deployment:
One Auto Scaling group
Multiple Auto Scaling groups
Auto-Discovery : Auto-Discovery is the preferred method to configure Cluster Autoscaler. Click here for more information.
Control-plane Node setup
Cluster Autoscaler will attempt to determine the CPU, memory, and GPU resources provided by an Auto Scaling Group based on the instance type specified in its Launch Configuration or Launch Template.
Copy
# 현재 autoscaling(ASG) 정보 확인
# aws autoscaling describe-auto-scaling-groups --query "AutoScalingGroups[? Tags[? (Key=='eks:cluster-name') && Value=='클러스터이름']].[AutoScalingGroupName, MinSize, MaxSize,DesiredCapacity]" --output table
aws autoscaling describe-auto-scaling-groups \
    --query "AutoScalingGroups[? Tags[? (Key=='eks:cluster-name') && Value=='myeks']].[AutoScalingGroupName, MinSize, MaxSize,DesiredCapacity]" \
    --output table
-----------------------------------------------------------------
|                   DescribeAutoScalingGroups                   |
+------------------------------------------------+----+----+----+
|  eks-ng1-18cab0c2-321a-d736-4f15-d31b91eff0cb  |  0 |  3 |  3 |
+------------------------------------------------+----+----+----+

# MaxSize 6개로 수정
export ASG_NAME=$(aws autoscaling describe-auto-scaling-groups --query "AutoScalingGroups[? Tags[? (Key=='eks:cluster-name') && Value=='myeks']].AutoScalingGroupName" --output text)
aws autoscaling update-auto-scaling-group --auto-scaling-group-name ${ASG_NAME} --min-size 3 --desired-capacity 3 --max-size 6

# 확인
aws autoscaling describe-auto-scaling-groups --query "AutoScalingGroups[? Tags[? (Key=='eks:cluster-name') && Value=='myeks']].[AutoScalingGroupName, MinSize, MaxSize,DesiredCapacity]" --output table
-----------------------------------------------------------------
|                   DescribeAutoScalingGroups                   |
+------------------------------------------------+----+----+----+
|  eks-ng1-18cab0c2-321a-d736-4f15-d31b91eff0cb  |  3 |  6 |  3 |
+------------------------------------------------+----+----+----+

# 배포 : Deploy the Cluster Autoscaler (CAS)
curl -s -O https://raw.githubusercontent.com/kubernetes/autoscaler/master/cluster-autoscaler/cloudprovider/aws/examples/cluster-autoscaler-autodiscover.yaml
...
            - ./cluster-autoscaler
            - --v=4
            - --stderrthreshold=info
            - --cloud-provider=aws
            - --skip-nodes-with-local-storage=false # 로컬 스토리지를 가진 노드를 autoscaler가 scale down할지 결정, false(가능!)
            - --expander=least-waste # 노드를 확장할 때 어떤 노드 그룹을 선택할지를 결정, least-waste는 리소스 낭비를 최소화하는 방식으로 새로운 노드를 선택.
            - --node-group-auto-discovery=asg:tag=k8s.io/cluster-autoscaler/enabled,k8s.io/cluster-autoscaler/
...

sed -i -e "s||$CLUSTER_NAME|g" cluster-autoscaler-autodiscover.yaml
kubectl apply -f cluster-autoscaler-autodiscover.yaml
serviceaccount/cluster-autoscaler created
clusterrole.rbac.authorization.k8s.io/cluster-autoscaler created
role.rbac.authorization.k8s.io/cluster-autoscaler created
clusterrolebinding.rbac.authorization.k8s.io/cluster-autoscaler created
rolebinding.rbac.authorization.k8s.io/cluster-autoscaler created
deployment.apps/cluster-autoscaler created

# 확인
kubectl get pod -n kube-system | grep cluster-autoscaler
kubectl describe deployments.apps -n kube-system cluster-autoscaler
kubectl describe deployments.apps -n kube-system cluster-autoscaler | grep node-group-auto-discovery
      --node-group-auto-discovery=asg:tag=k8s.io/cluster-autoscaler/enabled,k8s.io/cluster-autoscaler/myeks

# (옵션) cluster-autoscaler 파드가 동작하는 워커 노드가 퇴출(evict) 되지 않게 설정
kubectl -n kube-system annotate deployment.apps/cluster-autoscaler cluster-autoscaler.kubernetes.io/safe-to-evict="false"
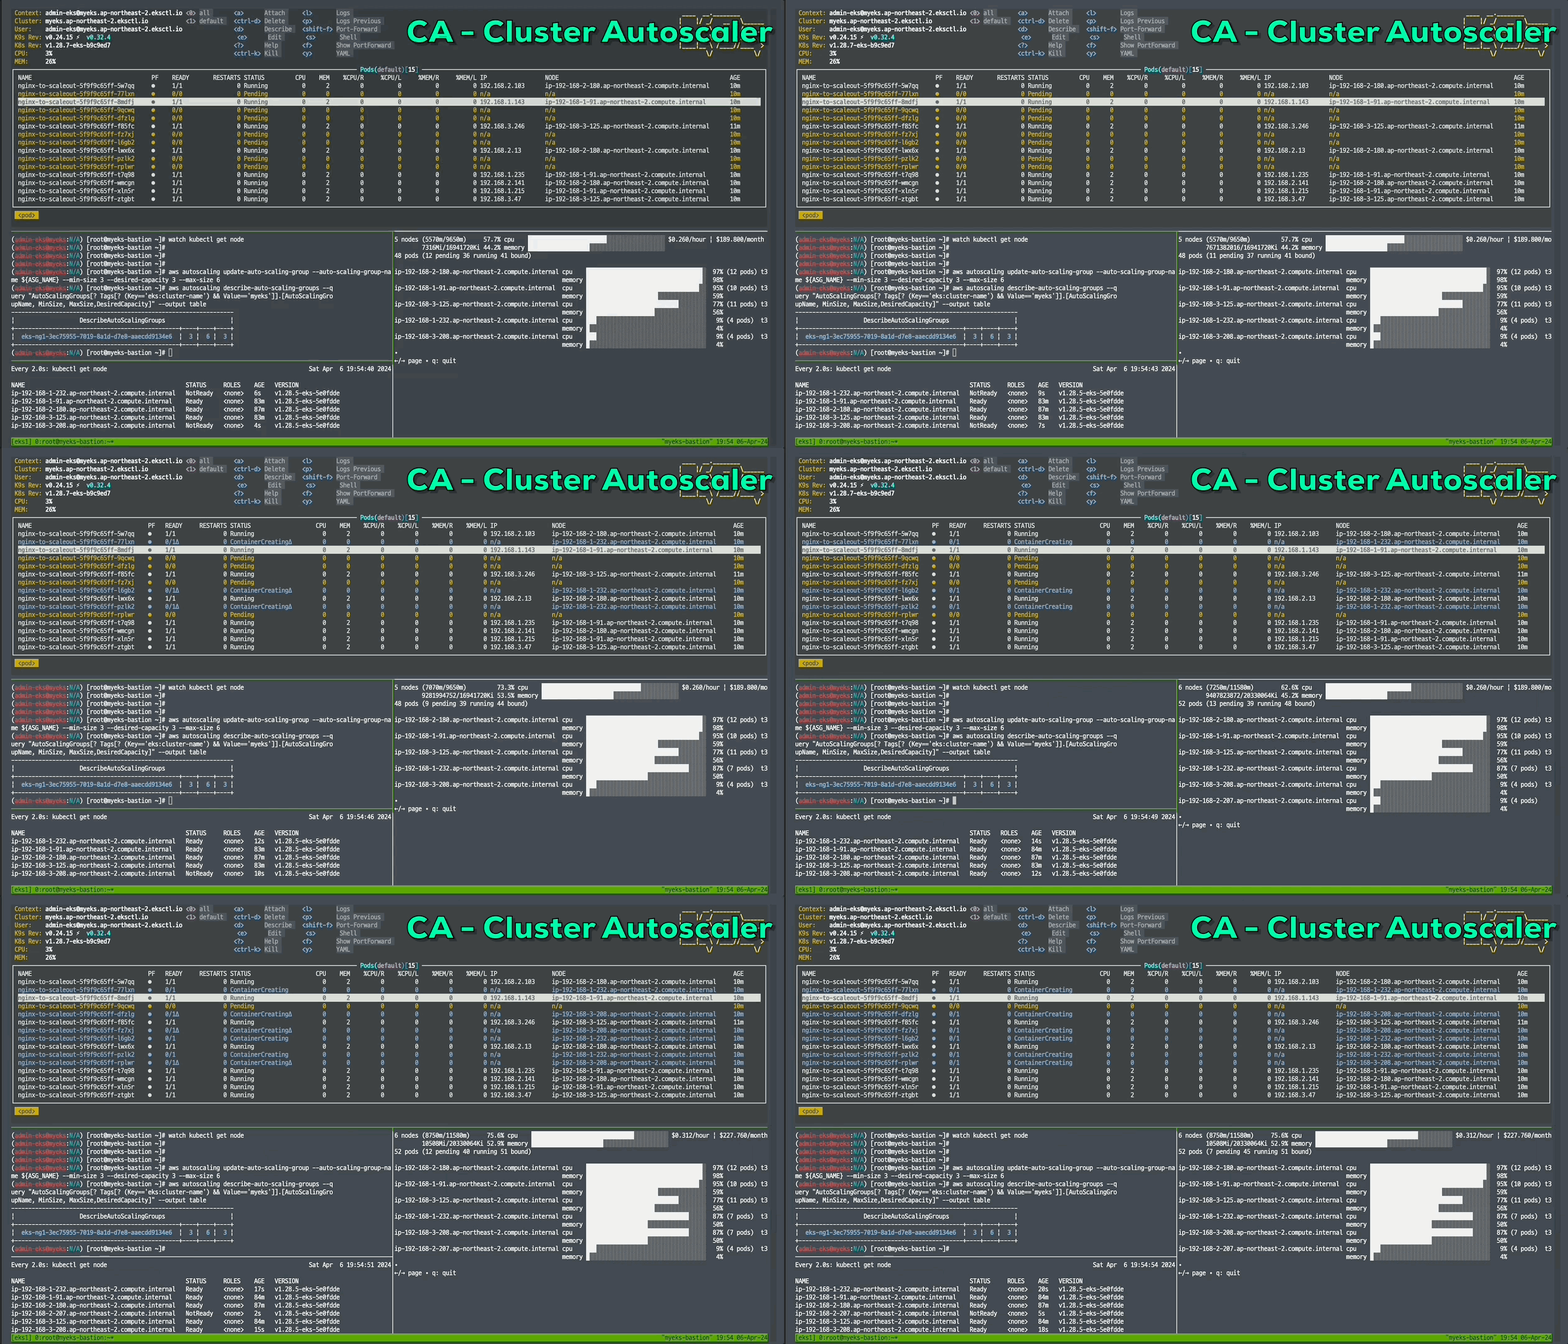
4.3. CAS 동작 확인
Copy
# 모니터링
kubectl get nodes -w
while true; do kubectl get node; echo "------------------------------" ; date ; sleep 1; done
while true; do aws ec2 describe-instances --query "Reservations[*].Instances[*].{PrivateIPAdd:PrivateIpAddress,InstanceName:Tags[?Key=='Name']|[0].Value,Status:State.Name}" --filters Name=instance-state-name,Values=running --output text ; echo "------------------------------"; date; sleep 1; done

# Deploy a Sample App
# We will deploy an sample nginx application as a ReplicaSet of 1 Pod
cat << EOF > nginx.yaml
apiVersion: apps/v1
kind: Deployment
metadata:
  name: nginx-to-scaleout
spec:
  replicas: 1
  selector:
    matchLabels:
      app: nginx
  template:
    metadata:
      labels:
        service: nginx
        app: nginx
    spec:
      containers:
      - image: nginx
        name: nginx-to-scaleout
        resources:
          limits:
            cpu: 500m
            memory: 512Mi
          requests:
            cpu: 500m
            memory: 512Mi
EOF
kubectl apply -f nginx.yaml
kubectl get deployment/nginx-to-scaleout

# Scale our ReplicaSet
# Let’s scale out the replicaset to 15
kubectl scale --replicas=15 deployment/nginx-to-scaleout && date

deployment.apps/nginx-to-scaleout scaled
Sat Mar  8 00:20:14 KST 2025

# 확인
kubectl get pods -l app=nginx -o wide --watch

kubectl -n kube-system logs -f deployment/cluster-autoscaler

I0307 15:20:19.360067       1 klogx.go:87] Pod default/nginx-to-scaleout-7cfb655fb5-xh6ls is unschedulable
I0307 15:20:19.360070       1 klogx.go:87] Pod default/nginx-to-scaleout-7cfb655fb5-pvd6z is unschedulable
I0307 15:20:19.360073       1 klogx.go:87] Pod default/nginx-to-scaleout-7cfb655fb5-p9qrl is unschedulable
I0307 15:20:19.360260       1 scale_up.go:194] Upcoming 0 nodes
I0307 15:20:19.360852       1 waste.go:55] Expanding Node Group eks-ng1-18cab0c2-321a-d736-4f15-d31b91eff0cb would waste 25.00% CPU, 59.87% Memory, 42.44% Blended
I0307 15:20:19.360866       1 scale_up.go:282] Best option to resize: eks-ng1-18cab0c2-321a-d736-4f15-d31b91eff0cb
I0307 15:20:19.360872       1 scale_up.go:286] Estimated 3 nodes needed in eks-ng1-18cab0c2-321a-d736-4f15-d31b91eff0cb # 현재 필요한 node 수 계산
I0307 15:20:19.360889       1 scale_up.go:405] Final scale-up plan: [{eks-ng1-18cab0c2-321a-d736-4f15-d31b91eff0cb 3->6 (max: 6)}] # 6개로 node 수 확정 후 scale out
I0307 15:20:19.360904       1 scale_up.go:608] Scale-up: setting group eks-ng1-18cab0c2-321a-d736-4f15-d31b91eff0cb size to 6 # scale out됨
I0307 15:20:19.360947       1 auto_scaling_groups.go:248] Setting asg eks-ng1-18cab0c2-321a-d736-4f15-d31b91eff0cb size to 6
I0307 15:20:19.361028       1 event_sink_logging_wrapper.go:48] Event(v1.ObjectReference{Kind:"ConfigMap", Namespace:"kube-system", Name:"cluster-autoscaler-status", UID:"0cb74c85-7760-47bc-8a9c-7e8dd5a55857", APIVersion:"v1", ResourceVersion:"1129016", FieldPath:""}): type: 'Normal' reason: 'ScaledUpGroup' Scale-up: setting group eks-ng1-18cab0c2-321a-d736-4f15-d31b91eff0cb size to 6 instead of 3 (max: 6)
I0307 15:20:19.485137       1 eventing_scale_up_processor.go:47] Skipping event processing for unschedulable pods since there is a ScaleUp attempt this loop
I0307 15:20:19.485439       1 event_sink_logging_wrapper.go:48] Event(v1.ObjectReference{Kind:"ConfigMap", Namespace:"kube-system", Name:"cluster-autoscaler-status", UID:"0cb74c85-7760-47bc-8a9c-7e8dd5a55857", APIVersion:"v1", ResourceVersion:"1129016", FieldPath:""}): type: 'Normal' reason: 'ScaledUpGroup' Scale-up: group eks-ng1-18cab0c2-321a-d736-4f15-d31b91eff0cb size set to 6 instead of 3 (max: 6)
I0307 15:20:19.496433       1 event_sink_logging_wrapper.go:48] Event(v1.ObjectReference{Kind:"Pod", Namespace:"default", Name:"nginx-to-scaleout-7cfb655fb5-548tk", UID:"6a892479-a9d8-4248-81e0-8a512203dc1c", APIVersion:"v1", ResourceVersion:"1129099", FieldPath:""}): type: 'Normal' reason: 'TriggeredScaleUp' pod triggered scale-up: [{eks-ng1-18cab0c2-321a-d736-4f15-d31b91eff0cb 3->6 (max: 6)}]
...
I0307 15:20:19.564176       1 event_sink_logging_wrapper.go:48] Event(v1.ObjectReference{Kind:"Pod", Namespace:"default", Name:"nginx-to-scaleout-7cfb655fb5-pvd6z", UID:"7067820c-f029-46e0-88d7-ba1affc71a5a", APIVersion:"v1", ResourceVersion:"1129108", FieldPath:""}): type: 'Normal' reason: 'TriggeredScaleUp' pod triggered scale-up: [{eks-ng1-18cab0c2-321a-d736-4f15-d31b91eff0cb 3->6 (max: 6)}]
I0307 15:20:19.573028       1 event_sink_logging_wrapper.go:48] Event(v1.ObjectReference{Kind:"Pod", Namespace:"default", Name:"nginx-to-scaleout-7cfb655fb5-p9qrl", UID:"226abc42-c506-4a4e-b205-f9251bda6b45", APIVersion:"v1", ResourceVersion:"1129118", FieldPath:""}): type: 'Normal' reason: 'TriggeredScaleUp' pod triggered scale-up: [{eks-ng1-18cab0c2-321a-d736-4f15-d31b91eff0cb 3->6 (max: 6)}]
I0307 15:20:29.509209       1 static_autoscaler.go:276] Starting main loop
I0307 15:20:29.510226       1 filter_out_schedulable.go:63] Filtering out schedulables
# scale out된 node에 unscheduled 였던 pod들이 배치됨
I0307 15:20:29.510412       1 hinting_simulator.go:77] Pod default/nginx-to-scaleout-7cfb655fb5-czz7p can be moved to template-node-for-eks-ng1-18cab0c2-321a-d736-4f15-d31b91eff0cb-3902890183311134652-upcoming-0
I0307 15:20:29.510514       1 hinting_simulator.go:77] Pod default/nginx-to-scaleout-7cfb655fb5-548tk can be moved to template-node-for-eks-ng1-18cab0c2-321a-d736-4f15-d31b91eff0cb-3902890183311134652-upcoming-0
...
# 노드 자동 증가 확인
kubectl get nodes
aws autoscaling describe-auto-scaling-groups \
    --query "AutoScalingGroups[? Tags[? (Key=='eks:cluster-name') && Value=='myeks']].[AutoScalingGroupName, MinSize, MaxSize,DesiredCapacity]" \
    --output table

NAME                                               STATUS   ROLES    AGE     VERSION
ip-192-168-1-116.ap-northeast-2.compute.internal   Ready       2m46s   v1.31.5-eks-5d632ec
ip-192-168-1-13.ap-northeast-2.compute.internal    Ready       38h     v1.31.5-eks-5d632ec
ip-192-168-2-115.ap-northeast-2.compute.internal   Ready       38h     v1.31.5-eks-5d632ec
ip-192-168-2-227.ap-northeast-2.compute.internal   Ready       2m49s   v1.31.5-eks-5d632ec
ip-192-168-3-106.ap-northeast-2.compute.internal   Ready       38h     v1.31.5-eks-5d632ec
ip-192-168-3-161.ap-northeast-2.compute.internal   Ready       2m50s   v1.31.5-eks-5d632ec
-----------------------------------------------------------------
|                   DescribeAutoScalingGroups                   |
+------------------------------------------------+----+----+----+
|  eks-ng1-18cab0c2-321a-d736-4f15-d31b91eff0cb  |  3 |  6 |  6 |
+------------------------------------------------+----+----+----+

eks-node-viewer --resources cpu,memory
혹은
eks-node-viewer

# [운영서버 EC2] 최근 1시간 Fleet API 호출 확인 - Link
# https://ap-northeast-2.console.aws.amazon.com/cloudtrailv2/home?region=ap-northeast-2#/events?EventName=CreateFleet
aws cloudtrail lookup-events \
  --lookup-attributes AttributeKey=EventName,AttributeValue=CreateFleet \
  --start-time "$(date -d '1 hour ago' --utc +%Y-%m-%dT%H:%M:%SZ)" \
  --end-time "$(date --utc +%Y-%m-%dT%H:%M:%SZ)"

# (참고) Event name : UpdateAutoScalingGroup
# https://ap-northeast-2.console.aws.amazon.com/cloudtrailv2/home?region=ap-northeast-2#/events?EventName=UpdateAutoScalingGroup


# 디플로이먼트 삭제
kubectl delete -f nginx.yaml && date

# [scale-down] 노드 갯수 축소 : 기본은 10분 후 scale down 됨, 물론 아래 flag 로 시간 수정 가능 >> 그러니 디플로이먼트 삭제 후 10분 기다리고 나서 보자!
# By default, cluster autoscaler will wait 10 minutes between scale down operations,
# you can adjust this using the --scale-down-delay-after-add, --scale-down-delay-after-delete,
# and --scale-down-delay-after-failure flag.
# E.g. --scale-down-delay-after-add=5m to decrease the scale down delay to 5 minutes after a node has been added.

# 터미널1
watch -d kubectl get node
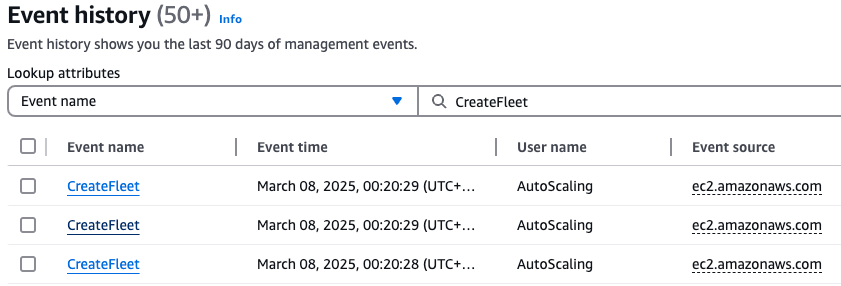
# CloudTrail 에 CreateFleet 이벤트 조회 : 최근 90일 가능
aws cloudtrail lookup-events --lookup-attributes AttributeKey=EventName,AttributeValue=CreateFleet
즉, eks cluster의 cluster-autoscaler pod가 unscheduled된 pod를 발견 → 해당 resource의 pod를 배포 할 수 있는 node spec 및 수 계산 → unscheduled pod 정상 배포 순으로 동작된다.
이 과정에서 cluster-autoscaler pod는 계산된 결과는 ec2 autoscaling api를 호출 하고, ec2 autoscaling에서 다시 CreateFleet을 요청한다. 즉, unscheduled pod가 탐지된 즉시 CreateFleet을 하는것이 아니라 autoscaling api를 호출하는 중간 과정을 거치기 때문에 불필요한 하나의 hop이 있다고 느낄 수 있다.
cluster-autocaler pod의 계산 방식
4.4. CAS 문제점 : 하나의 자원에 대해 두군데 (AWS ASG vs AWS EKS)에서 각자의 방식으로 관리 ⇒ 관리 정보가 서로 동기화되지 않아 다양한 문제 발생
[참고 영상] 오픈 소스 Karpenter를 활용한 Amazon EKS 확장 운영 전략 (신재현) 무신사 - 링크 , 원본영상
CA 문제점 : ASG에만 의존하고 노드 생성/삭제 등에 직접 관여 안함
EKS에서 노드를 삭제 해도 인스턴스는 삭제 안됨
노드 축소 될 때 특정 노드가 축소 되도록 하기 매우 어려움 : pod이 적은 노드 먼저 축소, 이미 드레인 된 노드 먼저 축소
특정 노드를 삭제 하면서 동시에 노드 개수를 줄이기 어려움 : 줄일때 삭제 정책 옵션이 다양하지 않음
특정 노드를 삭제하면서 동시에 노드 개수를 줄이기 어려움
폴링 방식이기에 너무 자주 확장 여유를 확인 하면 API 제한에 도달할 수 있음
스케일링 속도가 느림
Cluster Autoscaler 는 쿠버네티스 클러스터 자체의 오토 스케일링을 의미하며, 수요에 따라 워커 노드를 자동으로 추가하는 기능
언뜻 보기에 클러스터 전체나 각 노드의 부하 평균이 높아졌을 때 확장으로 보인다 → 함정! 🚧
Pending 상태의 파드가 생기는 타이밍에 처음으로 Cluster Autoscaler 이 동작한다
기본적으로 리소스에 의한 스케줄링은 Requests(최소)를 기준으로 이루어진다. 다시 말해 Requests 를 초과하여 할당한 경우에는 최소 리소스 요청만으로 리소스가 꽉 차 버려서 신규 노드를 추가해야만 한다. 이때 실제 컨테이너 프로세스가 사용하는 리소스 사용량은 고려되지 않는다.
반대로 Request 를 낮게 설정한 상태에서 Limit 차이가 나는 상황을 생각해보자. 각 컨테이너는 Limits 로 할당된 리소스를 최대로 사용한다. 그래서 실제 리소스 사용량이 높아졌더라도 Requests 합계로 보면 아직 스케줄링이 가능하기 때문에 클러스터가 스케일 아웃하지 않는 상황이 발생한다.
여기서는 CPU 리소스 할당을 예로 설명했지만 메모리의 경우도 마찬가지다.
CPA - Cluster Proportional Autoscaler
Karpenter
관리 간소화
노드 오버 프로비저닝 전략 : 우선순위 낮은 더미 파드 배치 활용
[영상] [CNKCD2024] 유연한 클라우드 운영을 위한 Karpenter 의 내부 메커니즘과 사례 분석 (강인호) : 정리 예정
Expiration 만료 : 기본 720시간(30일) 후 인스턴스를 자동으로 만료하여 강제로 노드를 최신 상태로 유지
Drift 드리프트 : 구성 변경 사항(NodePool, EC2NodeClass)를 감지하여 필요한 변경 사항을 적용
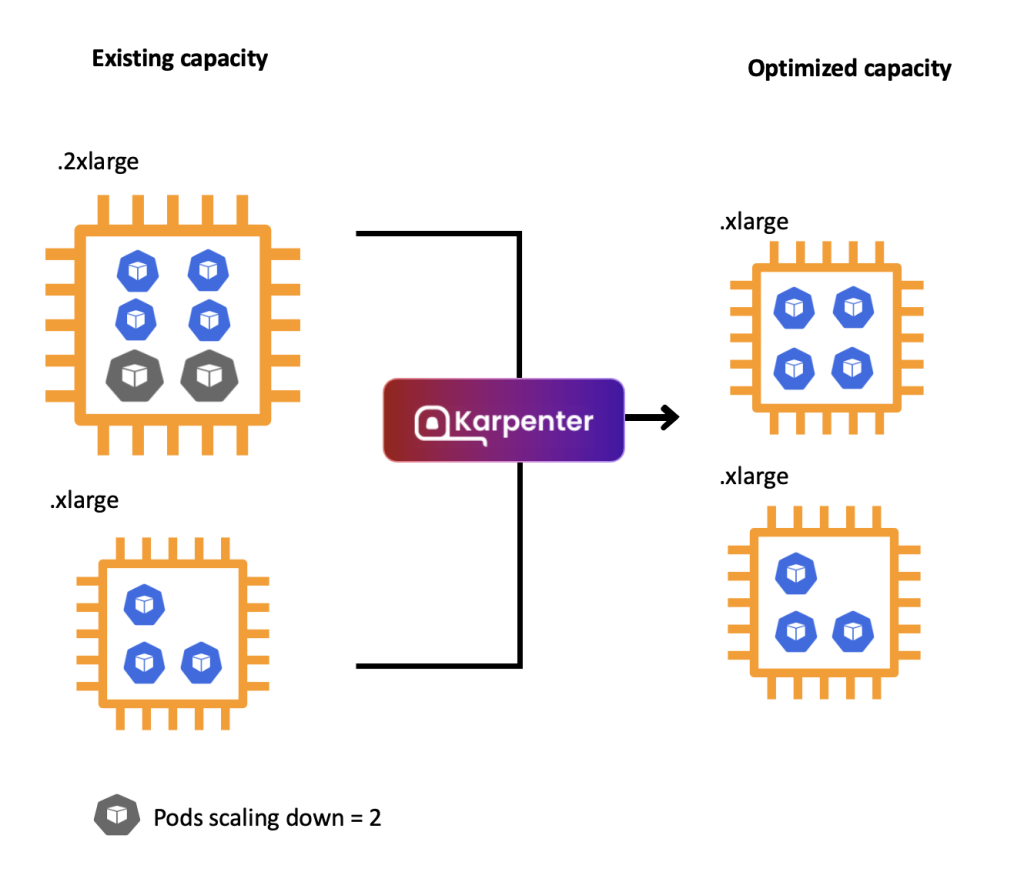
Consolidation 통합 : 비용 효율적인 컴퓨팅 최적화 선택
스팟 인스턴스 시작 시 Karpenter는 AWS EC2 Fleet Instance API를 호출하여 NodePool 구성 기반으로 선택한 인스턴스 유형을 전달.
AWS EC2 Fleet Instance API는 시작된 인스턴스 목록과 시작할 수 없는 인스턴스 목록을 즉시 반환하는 API로, 시작할 수 없을 경우 Karpenter는 대체 용량을 요청하거나 워크로드에 대한 soft 일정 제약 조건을 제거할 수 있음
Spot-to-Spot Consolidation 에는 주문형 통합과 다른 접근 방식이 필요했습니다. 온디맨드 통합의 경우 규모 조정 및 최저 가격이 주요 지표로 사용됩니다.
스팟 간 통합이 이루어지려면 Karpenter에는 최소 15개의 인스턴스 유형이 포함된 다양한 인스턴스 구성(연습에 정의된 NodePool 예제 참조)이 필요합니다. 이러한 제약 조건이 없으면 Karpenter가 가용성이 낮고 중단 빈도가 높은 인스턴스를 선택할 위험이 있습니다.
Copy
# 기존 nodepool 삭제
kubectl delete nodepool,ec2nodeclass default

# 모니터링
kubectl logs -f -n "${KARPENTER_NAMESPACE}" -l app.kubernetes.io/name=karpenter -c controller | jq '.'
eks-node-viewer --resources cpu,memory --node-selector "karpenter.sh/registered=true" --extra-labels eks-node-viewer/node-age
watch -d "kubectl get nodes -L karpenter.sh/nodepool -L node.kubernetes.io/instance-type -L karpenter.sh/capacity-type"

# Create a Karpenter NodePool and EC2NodeClass
cat <<EOF | envsubst | kubectl apply -f -
apiVersion: karpenter.sh/v1
kind: NodePool
metadata:
  name: default
spec:
  template:
    spec:
      nodeClassRef:
        group: karpenter.k8s.aws
        kind: EC2NodeClass
        name: default
      requirements:
        - key: kubernetes.io/os
          operator: In
          values: ["linux"]
        - key: karpenter.sh/capacity-type
          operator: In
          values: ["on-demand"]
        - key: karpenter.k8s.aws/instance-category
          operator: In
          values: ["c", "m", "r"]
        - key: karpenter.k8s.aws/instance-size
          operator: NotIn
          values: ["nano","micro","small","medium"]
        - key: karpenter.k8s.aws/instance-hypervisor
          operator: In
          values: ["nitro"]
      expireAfter: 1h # nodes are terminated automatically after 1 hour
  limits:
    cpu: "1000"
    memory: 1000Gi
  disruption:
    consolidationPolicy: WhenEmptyOrUnderutilized # policy enables Karpenter to replace nodes when they are either empty or underutilized
    consolidateAfter: 1m
---
apiVersion: karpenter.k8s.aws/v1
kind: EC2NodeClass
metadata:
  name: default
spec:
  role: "KarpenterNodeRole-${CLUSTER_NAME}" # replace with your cluster name
  amiSelectorTerms:
    - alias: "al2023@latest"
  subnetSelectorTerms:
    - tags:
        karpenter.sh/discovery: "${CLUSTER_NAME}" # replace with your cluster name
  securityGroupSelectorTerms:
    - tags:
        karpenter.sh/discovery: "${CLUSTER_NAME}" # replace with your cluster name
EOF

# 확인
kubectl get nodepool,ec2nodeclass

# Deploy a sample workload
cat <<EOF | kubectl apply -f -
apiVersion: apps/v1
kind: Deployment
metadata:
  name: inflate
spec:
  replicas: 5
  selector:
    matchLabels:
      app: inflate
  template:
    metadata:
      labels:
        app: inflate
    spec:
      terminationGracePeriodSeconds: 0
      securityContext:
        runAsUser: 1000
        runAsGroup: 3000
        fsGroup: 2000
      containers:
      - name: inflate
        image: public.ecr.aws/eks-distro/kubernetes/pause:3.7
        resources:
          requests:
            cpu: 1
            memory: 1.5Gi
        securityContext:
          allowPrivilegeEscalation: false
EOF


#
kubectl get nodes -L karpenter.sh/nodepool -L node.kubernetes.io/instance-type -L karpenter.sh/capacity-type
kubectl get nodeclaims
kubectl describe nodeclaims
kubectl logs -f -n "${KARPENTER_NAMESPACE}" -l app.kubernetes.io/name=karpenter -c controller | jq '.'
kubectl logs -n "${KARPENTER_NAMESPACE}" -l app.kubernetes.io/name=karpenter -c controller | grep 'launched nodeclaim' | jq '.'


# Scale the inflate workload from 5 to 12 replicas, triggering Karpenter to provision additional capacity
kubectl scale deployment/inflate --replicas 12

# This changes the total memory request for this deployment to around 12Gi,
# which when adjusted to account for the roughly 600Mi reserved for the kubelet on each node means that this will fit on 2 instances of type m5.large:
kubectl get nodeclaims


# Scale down the workload back down to 5 replicas
kubectl scale deployment/inflate --replicas 5
kubectl get nodeclaims
NAME            TYPE          CAPACITY    ZONE              NODE                                                READY     AGE
default-dfc52   c6g.2xlarge   on-demand   ap-northeast-2a   ip-192-168-136-55.ap-northeast-2.compute.internal   Unknown   23s


# We can check the Karpenter logs to get an idea of what actions it took in response to our scaling in the deployment. Wait about 5-10 seconds before running the following command:
kubectl logs -f -n "${KARPENTER_NAMESPACE}" -l app.kubernetes.io/name=karpenter -c controller | jq '.'

  "level": "INFO",
  "time": "2025-03-08T13:12:30.534Z",
  "logger": "controller",
  "message": "computed new nodeclaim(s) to fit pod(s)",
  "commit": "ff59416",
  "controller": "provisioner",
  "namespace": "",
  "name": "",
  "reconcileID": "0dad53d9-6cb9-4b41-81e5-eaa2e19f966f",
  "nodeclaims": 1,
  "pods": 5
}
{
  "level": "INFO",
  "time": "2025-03-08T13:12:30.546Z",
  "logger": "controller",
  "message": "created nodeclaim",
  "commit": "ff59416",
  "controller": "provisioner",
  "namespace": "",
  "name": "",
  "reconcileID": "0dad53d9-6cb9-4b41-81e5-eaa2e19f966f",
  "NodePool": {
    "name": "default"
  },
  "NodeClaim": {
    "name": "default-dfc52"
  },
  "requests": {
    "cpu": "5150m",
    "memory": "7680Mi",
    "pods": "9"
  },
  "instance-types": "c5.2xlarge, c5.4xlarge, c5a.2xlarge, c5a.4xlarge, c5d.2xlarge and 55 other(s)"
}
{
  "level": "INFO",
  "time": "2025-03-08T13:12:33.023Z",
  "logger": "controller",
  "message": "launched nodeclaim",
  "commit": "ff59416",
  "controller": "nodeclaim.lifecycle",
  "controllerGroup": "karpenter.sh",
  "controllerKind": "NodeClaim",
  "NodeClaim": {
    "name": "default-dfc52"
  },
  "namespace": "",
  "name": "default-dfc52",
  "reconcileID": "08bca9fb-6196-4dc8-a68a-40789cb6c952",
  "provider-id": "aws:///ap-northeast-2a/i-06750c46c7705225d",
  "instance-type": "c6g.2xlarge",
  "zone": "ap-northeast-2a",
  "capacity-type": "on-demand",
  "allocatable": {
    "cpu": "7910m",
    "ephemeral-storage": "17Gi",
    "memory": "14103Mi",
    "pods": "58",
    "vpc.amazonaws.com/pod-eni": "38"
  }
}
{
  "level": "INFO",
  "time": "2025-03-08T13:12:48.551Z",
  "logger": "controller",
  "message": "registered nodeclaim",
  "commit": "ff59416",
  "controller": "nodeclaim.lifecycle",
  "controllerGroup": "karpenter.sh",
  "controllerKind": "NodeClaim",
  "NodeClaim": {
    "name": "default-dfc52"
  },

# Karpenter can also further consolidate if a node can be replaced with a cheaper variant in response to workload changes.
# This can be demonstrated by scaling the inflate deployment replicas down to 1, with a total memory request of around 1Gi:
kubectl scale deployment/inflate --replicas 1
# underutilized된 node를 발견하고 replace disruption 발생. spec이 작은 node로 replace된다.
{
  "level": "INFO",
  "time": "2025-03-08T13:16:30.981Z",
  "logger": "controller",
  "message": "disrupting node(s)",
  "commit": "ff59416",
  "controller": "disruption",
  "namespace": "",
  "name": "",
  "reconcileID": "cdfa2eab-05b5-4e52-8417-6fe2e4dd0a6b",
  "command-id": "7626fdd2-b1c1-4178-a0bf-cd476745f9e6",
  "reason": "underutilized",
  "decision": "replace",
  "disrupted-node-count": 1,
  "replacement-node-count": 1,
  "pod-count": 1,
  "disrupted-nodes": [
    {
      "Node": {
        "name": "ip-192-168-136-55.ap-northeast-2.compute.internal"
      },
      "NodeClaim": {
        "name": "default-dfc52"
      },
      "capacity-type": "on-demand",
      "instance-type": "c6g.2xlarge"
    }
  ],
  "replacement-nodes": [
    {
      "capacity-type": "on-demand",
      "instance-types": "c6g.large, c7g.large, c5a.large, c6gd.large, m6g.large and 55 other(s)"
    }
  ]
}
# replace될 nodeclaims를 새롭게 생성한다.
{
  "level": "INFO",
  "time": "2025-03-08T13:16:31.063Z",
  "logger": "controller",
  "message": "created nodeclaim",
  "commit": "ff59416",
  "controller": "disruption",
  "namespace": "",
  "name": "",
  "reconcileID": "cdfa2eab-05b5-4e52-8417-6fe2e4dd0a6b",
  "NodePool": {
    "name": "default"
  },
  "NodeClaim": {
    "name": "default-zll8t"
  },
  "requests": {
    "cpu": "1150m",
    "memory": "1536Mi",
    "pods": "5"
  },
  "instance-types": "c5.large, c5.xlarge, c5a.large, c5a.xlarge, c5d.large and 55 other(s)"
}

kubectl get nodeclaims
NAME            TYPE          CAPACITY    ZONE              NODE                                                READY   AGE
default-dfc52   c6g.2xlarge   on-demand   ap-northeast-2a   ip-192-168-136-55.ap-northeast-2.compute.internal   True    3m16s

kubectl get nodeclaims
NAME            TYPE        CAPACITY    ZONE              NODE                                                READY   AGE
default-zll8t   c6g.large   on-demand   ap-northeast-2c   ip-192-168-185-33.ap-northeast-2.compute.internal   True    2m34s


# 삭제
kubectl delete deployment inflate
kubectl delete nodepool,ec2nodeclass default
6.4. Spot-to-Spot Consolidation 실습 해보기
Copy
# 모니터링
kubectl logs -f -n "${KARPENTER_NAMESPACE}" -l app.kubernetes.io/name=karpenter -c controller | jq '.'
eks-node-viewer --resources cpu,memory --node-selector "karpenter.sh/registered=true"

# Create a Karpenter NodePool and EC2NodeClass
cat <<EOF | envsubst | kubectl apply -f -
apiVersion: karpenter.sh/v1
kind: NodePool
metadata:
  name: default
spec:
  template:
    spec:
      nodeClassRef:
        group: karpenter.k8s.aws
        kind: EC2NodeClass
        name: default
      requirements:
        - key: kubernetes.io/os
          operator: In
          values: ["linux"]
        - key: karpenter.sh/capacity-type
          operator: In
          values: ["spot"]
        - key: karpenter.k8s.aws/instance-category
          operator: In
          values: ["c", "m", "r"]
        - key: karpenter.k8s.aws/instance-size
          operator: NotIn
          values: ["nano","micro","small","medium"]
        - key: karpenter.k8s.aws/instance-hypervisor
          operator: In
          values: ["nitro"]
      expireAfter: 1h # nodes are terminated automatically after 1 hour
  limits:
    cpu: "1000"
    memory: 1000Gi
  disruption:
    consolidationPolicy: WhenEmptyOrUnderutilized # policy enables Karpenter to replace nodes when they are either empty or underutilized
    consolidateAfter: 1m
---
apiVersion: karpenter.k8s.aws/v1
kind: EC2NodeClass
metadata:
  name: default
spec:
  role: "KarpenterNodeRole-${CLUSTER_NAME}" # replace with your cluster name
  amiSelectorTerms:
    - alias: "bottlerocket@latest"
  subnetSelectorTerms:
    - tags:
        karpenter.sh/discovery: "${CLUSTER_NAME}" # replace with your cluster name
  securityGroupSelectorTerms:
    - tags:
        karpenter.sh/discovery: "${CLUSTER_NAME}" # replace with your cluster name
EOF

# 확인
kubectl get nodepool,ec2nodeclass

# Deploy a sample workload
cat <<EOF | kubectl apply -f -
apiVersion: apps/v1
kind: Deployment
metadata:
  name: inflate
spec:
  replicas: 5
  selector:
    matchLabels:
      app: inflate
  template:
    metadata:
      labels:
        app: inflate
    spec:
      terminationGracePeriodSeconds: 0
      securityContext:
        runAsUser: 1000
        runAsGroup: 3000
        fsGroup: 2000
      containers:
      - name: inflate
        image: public.ecr.aws/eks-distro/kubernetes/pause:3.7
        resources:
          requests:
            cpu: 1
            memory: 1.5Gi
        securityContext:
          allowPrivilegeEscalation: false
EOF

#
kubectl get nodes -L karpenter.sh/nodepool -L node.kubernetes.io/instance-type -L karpenter.sh/capacity-type
kubectl get nodeclaims
kubectl describe nodeclaims
kubectl logs -f -n "${KARPENTER_NAMESPACE}" -l app.kubernetes.io/name=karpenter -c controller | jq '.'
kubectl logs -n "${KARPENTER_NAMESPACE}" -l app.kubernetes.io/name=karpenter -c controller | grep 'launched nodeclaim' | jq '.'

# Scale the inflate workload from 5 to 12 replicas, triggering Karpenter to provision additional capacity
kubectl scale deployment/inflate --replicas 12

# This changes the total memory request for this deployment to around 12Gi,
# which when adjusted to account for the roughly 600Mi reserved for the kubelet on each node means that this will fit on 2 instances of type m5.large:
kubectl get nodeclaims

# Scale down the workload back down to 5 replicas
kubectl scale deployment/inflate --replicas 5
kubectl get nodeclaims

# We can check the Karpenter logs to get an idea of what actions it took in response to our scaling in the deployment. Wait about 5-10 seconds before running the following command:
kubectl logs -f -n "${KARPENTER_NAMESPACE}" -l app.kubernetes.io/name=karpenter -c controller | jq '.'

# Karpenter can also further consolidate if a node can be replaced with a cheaper variant in response to workload changes.
# This can be demonstrated by scaling the inflate deployment replicas down to 1, with a total memory request of around 1Gi:
kubectl scale deployment/inflate --replicas 1
kubectl logs -f -n "${KARPENTER_NAMESPACE}" -l app.kubernetes.io/name=karpenter -c controller | jq '.'
kubectl get nodeclaims

# 삭제
kubectl delete deployment inflate
kubectl delete nodepool,ec2nodeclass default

 Copy
Copy
 Copy
Copy