ABOUT ME

-

Today
-
Yesterday
-
Total
-
  • [AEWS 3기] 4주차 - EKS Observability
    AWS 2025. 3. 1. 23:01


    4주차 EKS Observability


    1. Observability 실습 환경[Q] 모니터링 monitoring 과 관측 가능성 observability(o11y) 의 정의와 차이점?
      측면 모니터링 관측 가능성
      정의 특정 메트릭 추적으로 문제 감지 외부 출력 데이터로 시스템 상태 이해
      목표 문제 발생 시 감지 및 경고 문제 원인 진단 및 시스템 최적화
      데이터 소스 미리 정의된 메트릭 (CPU, 메모리 등) 로그, 메트릭, 트레이스, 이벤트
      시스템 유형 단순한 시스템, 잘 알려진 파라미터 복잡한 분산 시스템, 다중 컴포넌트
      상호작용 방식 정적 경고 (임계값 기반) 동적 쿼리 및 분석 (질문 기반)
      • 모니터링의 정의와 특징 : 사전에 정의된 기준을 기반으로 시스템의 상태를 감시에 중점
        • 모니터링은 IT 시스템의 운영 상태를 추적하고, 성능 지표를 수집하며, 예상치 못한 문제를 조기에 감지하는 과정입니다. What is IT monitoring? | Definition from TechTarget에 따르면, 모니터링은 하드웨어와 소프트웨어의 메트릭을 수집하여 모든 것이 정상적으로 작동하는지 확인하고, 문제를 탐지하며 해결하는 데 사용됩니다.
          • 주요 활동: CPU 사용량, 메모리 사용량, 응답 시간, 오류율 등 특정 지표를 지속적으로 측정.
          • 목적: 시스템 다운타임을 방지하고, 경고를 통해 팀이 빠르게 대응할 수 있도록 함.
          • 빈도: 연속적이거나 일정 간격(일간, 주간, 월간)으로 수행됨.
        • 모니터링은 주로 단순하고 잘 알려진 시스템에 적합하며, 미리 설정된 임계값을 초과하면 알림을 발송하는 방식으로 작동합니다. 예를 들어, 서버의 CPU 사용량이 90%를 초과하면 경고가 발생할 수 있습니다.
      • 관측 가능성의 정의와 특징 : 수집된 다양한 데이터를 활용하여 예측되지 않은 문제까지 분석
        • 관측 가능성은 시스템의 내부 상태를 외부 출력 데이터(로그, 메트릭, 트레이스)를 통해 이해할 수 있는 능력을 의미합니다. Observability (software) - Wikipedia에 따르면, 관측 가능성은 소프트웨어 엔지니어링에서 프로그램 실행, 모듈 내부 상태, 컴포넌트 간 통신 데이터를 수집하고 분석하는 능력을 말합니다.
          • 핵심 데이터: 로그(이벤트 기록), 메트릭(수치 데이터), 트레이스(요청 흐름 추적), 그리고 일부 경우 이벤트가 포함됩니다.
          • 목적: 복잡한 분산 시스템에서 문제를 진단하고, 새로운 문제를 탐지하며, 시스템 동작을 최적화.
          • What Is Observability? | IBM에서는 관측 가능성을 "복잡한 시스템의 내부 상태를 외부 출력 데이터로 이해하는 능력"으로 정의하며, 특히 클라우드 환경에서 중요하다고 강조합니다.
          • 예시: 애플리케이션이 느려진 이유가 특정 마이크로서비스의 데이터베이스 연결 문제 때문이라는 것을 로그와 트레이스를 통해 파악.
        • 관측 가능성은 특히 현대의 분산 아키텍처(예: 마이크로서비스, 컨테이너)에서 필수적이며, 미리 정의되지 않은 질문에 답할 수 있는 유연성을 제공합니다. 예를 들어, "왜 이 특정 요청이 실패했는가?"라는 질문을 로그와 트레이스를 통해 분석할 수 있습니다. → 콘텍스트 context(문맥) 정보를 제공
        • APM 대신 추적 tracing 이라고 부르며, 계측 instrumentation텔레메트리 telemetry 라는 용어를 범용적으로 사용함.
      • 차이점
        1. 목적:
          • 모니터링: 시스템의 건강 상태를 확인하고, 문제가 발생했는지 감지. 예: 서버 다운 감지.
          • 관측 가능성: 문제의 원인을 진단하고, 시스템 동작을 이해. 예: 왜 서버가 다운되었는지 분석.
        1. 데이터 수집:
          • 모니터링: 미리 정의된 메트릭(CPU 사용량, 메모리 사용량 등)에 초점. Monitoring - Oxford Reference에서는 모니터링을 "특정 프로세스의 성능 분석"으로 정의.
        1. 시스템 복잡성:
          • 모니터링: 단순한 시스템에 적합, 예: 단일 서버 환경.
        1. 사용자 상호작용:
          • 모니터링: 경고 기반, 예: 임계값 초과 시 알림.
          • 관측 가능성: 동적 쿼리 및 분석 가능, 예: 특정 로그를 검색해 문제 원인 찾기.

      # YAML 파일 다운로드
      curl -O https://s3.ap-northeast-2.amazonaws.com/cloudformation.cloudneta.net/K8S/myeks-4week.yaml
      
      # 변수 지정
      CLUSTER_NAME=myeks
      SSHKEYNAME=<SSH 키 페이 이름>
      MYACCESSKEY=<IAM Uesr 액세스 키>
      MYSECRETKEY=<IAM Uesr 시크릿 키>
      WorkerNodeInstanceType=<워커 노드 인스턴스 타입> # 워커노드 인스턴스 타입 변경 가능
      
      # CloudFormation 스택 배포
      aws cloudformation deploy --template-file myeks-4week.yaml --stack-name $CLUSTER_NAME --parameter-overrides KeyName=$SSHKEYNAME SgIngressSshCidr=$(curl -s ipinfo.io/ip)/32  MyIamUserAccessKeyID=$MYACCESSKEY MyIamUserSecretAccessKey=$MYSECRETKEY ClusterBaseName=$CLUSTER_NAME WorkerNodeInstanceType=$WorkerNodeInstanceType --region ap-northeast-2
      
      # CloudFormation 스택 배포 완료 후 작업용 EC2 IP 출력
      aws cloudformation describe-stacks --stack-name myeks --query 'Stacks[*].Outputs[0].OutputValue' --output text
      • (옵션) 배포 과정 살펴보기
      # 운영서버 EC2 SSH 접속
      ssh -i <SSH 키 파일 위치> ec2-user@$(aws cloudformation describe-stacks --stack-name myeks --query 'Stacks[*].Outputs[0].OutputValue' --output text)
      ssh -i ~/.ssh/kp-gasida.pem ec2-user@$(aws cloudformation describe-stacks --stack-name myeks --query 'Stacks[*].Outputs[0].OutputValue' --output text)
      -------------------------------------------------
      #
      whoami
      pwd
      
      # cloud-init 실행 과정 로그 확인
      tail -f /var/log/cloud-init-output.log
      
      # eks 설정 파일 확인
      cat myeks.yaml
      
      # cloud-init 정상 완료 후 eksctl 실행 과정 로그 확인
      tail -f /root/create-eks.log
      
      #
      exit
      -------------------------------------------------
    2. 0.1. CloudFormation 스택 배포 한줄 실행! ← 실행하는 PC에 aws cli 설치되어 있고, aws configure 자격증명 설정 상태.
    3. observability 의 메트릭 metric, 로그 log, 추적 tracing 이란?
      비교 항목 메트릭 (Metrics) 로그 (Logs) 추적 (Tracing)
      정의 수치로 표현된 성능 데이터 시스템 이벤트 기록 요청이 시스템을 거치는 과정 추적
      형태 숫자 (정량적 데이터) 텍스트 (비정형 데이터) 트랜잭션 흐름 데이터
      예시 데이터 CPU 사용률, 응답 시간, 요청 수 오류 메시지, 로그인 시도, API 호출 로그 A 서비스 → B 서비스 → C 서비스 요청 흐름
      주요 목적 시스템 성능 모니터링 및 알람 이벤트 분석 및 디버깅 서비스 간 호출 경로 및 병목 현상 분석
      저장 방식 시계열 데이터베이스(TSDB) 로그 파일 또는 로그 관리 시스템 분산 트레이싱 시스템 (Jaeger, Zipkin)
      활용 도구 Prometheus, Grafana ELK Stack, Loki Jaeger, Zipkin
      • 메트릭(Metrics): 시스템의 성능을 정량적으로 모니터링
        • 메트릭은 시스템의 성능과 건강 상태를 수치로 표현한 데이터입니다. 예를 들어, CPU 사용량, 메모리 사용량, 요청 지연 시간, 오류율 등이 있습니다. 이는 시스템의 전반적인 상태를 한눈에 볼 수 있게 도와주며, 이상 징후를 빠르게 감지할 수 있습니다. 놀라운 점은 메트릭이 시간에 따른 추세를 보여주며, 대시보드와 경고 시스템에 자주 사용된다는 것입니다.
      • 로그(Logs): 이벤트 기반의 디버깅 및 문제 분석
        • 로그는 시스템에서 발생한 이벤트를 기록한 텍스트나 구조화된 데이터입니다. 특정 행동이나 오류가 발생한 시점과 이유를 자세히 알 수 있어 디버깅에 유용합니다. 예를 들어, 애플리케이션이 오류를 낼 때 로그를 통해 그 원인을 찾을 수 있습니다.
      • 추적(Tracing): 분산 시스템에서 요청 흐름을 파악하고 병목 현상 분석
        • 추적, 특히 분산 추적은 요청이 분산 시스템의 여러 구성 요소를 통해 어떻게 이동하는지 추적하는 것입니다. 이는 요청의 흐름을 시각화하고, 성능 병목 현상을 찾거나 여러 서비스에 걸친 문제를 진단하는 데 도움을 줍니다. 예를 들어, 사용자가 웹사이트에서 버튼을 클릭하면 그 요청이 백엔드 서비스를 어떻게 거치는지 알 수 있습니다.

      비교 항목 SLI (서비스 수준 지표) SLO (서비스 수준 목표) SLA (서비스 수준 계약)
      정의 서비스 성능을 측정하는 실제 값 유지해야 하는 성능 목표 고객과 맺은 공식 계약
      목적 현재 서비스 상태를 모니터링 내부적으로 목표 수준을 설정 고객과의 계약 보장
      예제 99.95%의 가용성 99.9% 이상의 가용성 목표 99.9% 미만이면 환불 제공
      법적 구속력 ❌ 없음 ❌ 없음 ✅ 있음
      위반 시 결과 단순 데이터 측정 내부 경고 및 개선 조치 보상금 지급, 계약 위반 가능
      SLI (Service Level Indicator, 서비스 수준 지표)
      • SLO는 서비스가 유지해야 하는 목표 수준을 정의하는 값으로, SLI(실제 측정값)에 대한 **기준선(threshold)**을 설정합니다.
      • 즉, "이 정도의 성능을 유지해야 한다"는 목표를 의미합니다.
      • 예제
        • 가용성 SLO: "서비스 가용성 99.9% 이상 유지"
        • 응답 시간 SLO: "모든 요청의 95%는 200ms 이내에 응답해야 한다"
        • 오류율 SLO: "오류율 0.1% 이하 유지"

      📌 SLO는 내부 목표이며, SLA(계약)와 다릅니다.


      • SLA는 서비스 제공자와 고객 간에 체결된 공식적인 계약으로, 서비스 품질을 보장하는 법적 문서입니다.
      • SLA는 SLO와 달리 계약 위반 시 **페널티(배상)**가 존재할 수 있습니다.
      • 예제
        • 가용성 SLA: "서비스 가용성이 99.9% 미만이면, 고객에게 요금의 10% 환불"
        • 응답 시간 SLA: "트랜잭션 응답 시간이 500ms를 초과하면, 서비스 제공자가 손해 배상"

      📌 SLA는 법적 계약이므로, 위반 시 금전적 보상이 따를 수 있습니다.

      신뢰성 향상을 위한 SLI/SLO 도입 1편 - 소개와 필요성
      시작하며 안녕하세요. SRE(site reliability engineering, 사이트 안정성 엔지니어링) 업무를 맡고 있는 Enablement Engineering 팀 어다희,...
      https://techblog.lycorp.co.jp/ko/sli-and-slo-for-improving-reliability-1
      신뢰성 향상을 위한 SLI/SLO 도입 2편 - 플랫폼 적용 사례
      시작하며 안녕하세요. Enablement Engineering 팀에서 SRE(site reliability engineer)로 일하고 있는 어다희입니다. 저희 팀은 LINE 서비스...
      https://techblog.lycorp.co.jp/ko/sli-and-slo-for-improving-reliability-2
    4. SLA (Service Level Agreement, 서비스 수준 계약)
    5. SLO (Service Level Objective, 서비스 수준 목표)
      • SLI는 서비스 품질을 정량적으로 측정하는 주요 성능 지표입니다.
      • 즉, 서비스의 신뢰성과 성능을 평가하는 데 사용되는 실제 측정된 값입니다.
      • 예제
        • 웹 서비스의 응답 시간: 100ms 이내의 응답률이 99.9%
        • 가용성: 30일 동안 서비스 정상 작동 시간의 비율 (예: 99.99%)
        • 오류율: 총 요청 중 오류 응답(5xx, 4xx)이 발생한 비율
        • 트래픽 지연율: 네트워크 요청의 평균 응답 시간
      📌 SLI는 측정값이므로, 실제 운영 데이터에서 계산됩니다.
    6. (추가 정보) SLI, SLO, SLA
    7.  

    0.2. 자신의 PC에서 AWS EKS 설치 확인 ←

    스택 생성 시작 후 20분 후 접속 할 것
    • EKS 설치 확인 및 kubeconfig 업데이트
      # 변수 지정
      CLUSTER_NAME=myeks
      SSHKEYNAME=kp-gasida
      
      #
      eksctl get cluster
      eksctl get nodegroup --cluster $CLUSTER_NAME
      eksctl get addon --cluster $CLUSTER_NAME
      eksctl get iamserviceaccount --cluster $CLUSTER_NAME
      
      # kubeconfig 생성
      aws sts get-caller-identity --query Arn
      aws eks update-kubeconfig --name myeks --user-alias <위 출력된 자격증명 사용자>
      aws eks update-kubeconfig --name myeks --user-alias admin
      
      # 
      kubectl cluster-info
      kubectl ns default
      kubectl get node -v6
      kubectl get node --label-columns=node.kubernetes.io/instance-type,eks.amazonaws.com/capacityType,topology.kubernetes.io/zone
      kubectl get pod -A
      kubectl get pdb -n kube-system
      
      # krew 플러그인 확인
      kubectl krew list
      kubectl get-all
    • AWS 관리 콘솔 확인
      • EKS 서비스 확인 : Overview, Compute, Networking, Add-ons, Access
      • EC2 서비스 확인 : type, az, IP, ec2 instance profile → iam role 확인
    • 노드 IP 정보 확인 및 SSH 접속
      # 인스턴스 정보 확인
      aws ec2 describe-instances --query "Reservations[*].Instances[*].{InstanceID:InstanceId, PublicIPAdd:PublicIpAddress, PrivateIPAdd:PrivateIpAddress, InstanceName:Tags[?Key=='Name']|[0].Value, Status:State.Name}" --filters Name=instance-state-name,Values=running --output table
      
      # EC2 공인 IP 변수 지정
      export N1=$(aws ec2 describe-instances --filters "Name=tag:Name,Values=myeks-ng1-Node" "Name=availability-zone,Values=ap-northeast-2a" --query 'Reservations[*].Instances[*].PublicIpAddress' --output text)
      export N2=$(aws ec2 describe-instances --filters "Name=tag:Name,Values=myeks-ng1-Node" "Name=availability-zone,Values=ap-northeast-2b" --query 'Reservations[*].Instances[*].PublicIpAddress' --output text)
      export N3=$(aws ec2 describe-instances --filters "Name=tag:Name,Values=myeks-ng1-Node" "Name=availability-zone,Values=ap-northeast-2c" --query 'Reservations[*].Instances[*].PublicIpAddress' --output text)
      echo $N1, $N2, $N3
      
      # *remoteAccess* 포함된 보안그룹 ID
      aws ec2 describe-security-groups --filters "Name=group-name,Values=*remoteAccess*" | jq
      export MNSGID=$(aws ec2 describe-security-groups --filters "Name=group-name,Values=*remoteAccess*" --query 'SecurityGroups[*].GroupId' --output text)
      
      # 해당 보안그룹 inbound 에 자신의 집 공인 IP 룰 추가
      aws ec2 authorize-security-group-ingress --group-id $MNSGID --protocol '-1' --cidr $(curl -s ipinfo.io/ip)/32
      
      # 해당 보안그룹 inbound 에 운영서버 내부 IP 룰 추가
      aws ec2 authorize-security-group-ingress --group-id $MNSGID --protocol '-1' --cidr 172.20.1.100/32
      
      # 워커 노드 SSH 접속
      for i in $N1 $N2 $N3; do echo ">> node $i <<"; ssh -o StrictHostKeyChecking=no ec2-user@$i hostname; echo; done
      
      ssh ec2-user@$N1
      exit
      ssh ec2-user@$N2
      exit
      ssh ec2-user@$N2
      exit
      • (옵션) AWS EC2 System Manager - Session Manager 로 관리형 노드 그룹(EC2) 접속
    • 노드 기본 정보 확인
      # 노드 기본 정보 확인
      for i in $N1 $N2 $N3; do echo ">> node $i <<"; ssh ec2-user@$i hostnamectl; echo; done
      for i in $N1 $N2 $N3; do echo ">> node $i <<"; ssh ec2-user@$i sudo ip -c addr; echo; done
      
      # 
      for i in $N1 $N2 $N3; do echo ">> node $i <<"; ssh ec2-user@$i lsblk; echo; done
      for i in $N1 $N2 $N3; do echo ">> node $i <<"; ssh ec2-user@$i df -hT /; echo; done
      
      # 스토리지클래스 및 CSI 노드 확인
      kubectl get sc
      kubectl get csinodes
      
      # max-pods 정보 확인
      kubectl describe node | grep Capacity: -A13
      kubectl get nodes -o custom-columns="NAME:.metadata.name,MAXPODS:.status.capacity.pods"
      
      # 노드에서 확인
      for i in $N1 $N2 $N3; do echo ">> node $i <<"; ssh ec2-user@$i cat /etc/eks/bootstrap.sh; echo; done
      ssh ec2-user@$N1 sudo cat /etc/kubernetes/kubelet/config.json | jq
      for i in $N1 $N2 $N3; do echo ">> node $i <<"; ssh ec2-user@$i sudo cat /etc/kubernetes/kubelet/config.json | grep maxPods; echo; done
      for i in $N1 $N2 $N3; do echo ">> node $i <<"; ssh ec2-user@$i sudo cat /etc/kubernetes/kubelet/config.json.d/00-nodeadm.conf | grep maxPods; echo; done

    0.3. 운영서버 EC2 SSH 접속 (SSH 키 파일 사용) : AWS EKS 설치 확인 ←

    스택 생성 시작 후 20분 후 접속 할 것
    • SSH 접속 후 기본 확인
      # default 네임스페이스 적용
      kubectl ns default
      
      # 환경변수 정보 확인
      export | egrep 'ACCOUNT|AWS_|CLUSTER|KUBERNETES|VPC|Subnet'
      export | egrep 'ACCOUNT|AWS_|CLUSTER|KUBERNETES|VPC|Subnet' | egrep -v 'KEY'
      
      # krew 플러그인 확인
      kubectl krew list
    • 노드 정보 확인 및 SSH 접속
      # 인스턴스 정보 확인
      aws ec2 describe-instances --query "Reservations[*].Instances[*].{InstanceID:InstanceId, PublicIPAdd:PublicIpAddress, PrivateIPAdd:PrivateIpAddress, InstanceName:Tags[?Key=='Name']|[0].Value, Status:State.Name}" --filters Name=instance-state-name,Values=running --output table
      
      # 노드 IP 확인 및 PrivateIP 변수 지정
      aws ec2 describe-instances --query "Reservations[*].Instances[*].{PublicIPAdd:PublicIpAddress,PrivateIPAdd:PrivateIpAddress,InstanceName:Tags[?Key=='Name']|[0].Value,Status:State.Name}" --filters Name=instance-state-name,Values=running --output table
      N1=$(kubectl get node --label-columns=topology.kubernetes.io/zone --selector=topology.kubernetes.io/zone=ap-northeast-2a -o jsonpath={.items[0].status.addresses[0].address})
      N2=$(kubectl get node --label-columns=topology.kubernetes.io/zone --selector=topology.kubernetes.io/zone=ap-northeast-2b -o jsonpath={.items[0].status.addresses[0].address})
      N3=$(kubectl get node --label-columns=topology.kubernetes.io/zone --selector=topology.kubernetes.io/zone=ap-northeast-2c -o jsonpath={.items[0].status.addresses[0].address})
      echo "export N1=$N1" >> /etc/profile
      echo "export N2=$N2" >> /etc/profile
      echo "export N3=$N3" >> /etc/profile
      echo $N1, $N2, $N3
      
      # 노드 IP 로 ping 테스트
      for i in $N1 $N2 $N3; do echo ">> node $i <<"; ping -c 1 $i ; echo; done
    • Tip. 자리 이동으로 인해 운영서버 EC2에 접속하는 공인IP가 변경 시 보안 그룹에 추가하는 방법
      # 자신의 PC(맥 기준)에서 아래 명령어 실행 >> 윈도우 CMD 명령어 입력 아시는 분은 댓글 주세요. 업데이트하겠습니다.
      MYSGID=$(aws ec2 describe-security-groups --filters "Name=tag:Name,Values=operator-HOST-SG" --query "SecurityGroups[*].[GroupId]" --output text)
      aws ec2 authorize-security-group-ingress --group-id $MYSGID --protocol '-1' --cidr $(curl -s ipinfo.io/ip)/32

    0.4. EKS 배포 후 실습 편의를 위한 설정 :

    macOS

    ,

    Windows

    (WSL2)

    • macOS ⇒ 실습 완료 후 삭제 할 것!
      # 변수 지정
      export CLUSTER_NAME=myeks
      export VPCID=$(aws ec2 describe-vpcs --filters "Name=tag:Name,Values=$CLUSTER_NAME-VPC" --query 'Vpcs[*].VpcId' --output text)
      export PubSubnet1=$(aws ec2 describe-subnets --filters Name=tag:Name,Values="$CLUSTER_NAME-Vpc1PublicSubnet1" --query "Subnets[0].[SubnetId]" --output text)
      export PubSubnet2=$(aws ec2 describe-subnets --filters Name=tag:Name,Values="$CLUSTER_NAME-Vpc1PublicSubnet2" --query "Subnets[0].[SubnetId]" --output text)
      export PubSubnet3=$(aws ec2 describe-subnets --filters Name=tag:Name,Values="$CLUSTER_NAME-Vpc1PublicSubnet3" --query "Subnets[0].[SubnetId]" --output text)
      export N1=$(aws ec2 describe-instances --filters "Name=tag:Name,Values=$CLUSTER_NAME-ng1-Node" "Name=availability-zone,Values=ap-northeast-2a" --query 'Reservations[*].Instances[*].PublicIpAddress' --output text)
      export N2=$(aws ec2 describe-instances --filters "Name=tag:Name,Values=$CLUSTER_NAME-ng1-Node" "Name=availability-zone,Values=ap-northeast-2b" --query 'Reservations[*].Instances[*].PublicIpAddress' --output text)
      export N3=$(aws ec2 describe-instances --filters "Name=tag:Name,Values=$CLUSTER_NAME-ng1-Node" "Name=availability-zone,Values=ap-northeast-2c" --query 'Reservations[*].Instances[*].PublicIpAddress' --output text)
      export CERT_ARN=$(aws acm list-certificates --query 'CertificateSummaryList[].CertificateArn[]' --output text) #사용 리전의 인증서 ARN 확인
      MyDomain=gasida.link # 각자 자신의 도메인 이름 입력
      MyDnzHostedZoneId=$(aws route53 list-hosted-zones-by-name --dns-name "$MyDomain." --query "HostedZones[0].Id" --output text)
      
      
      # 실습 완료 후 삭제 할 것!
      cat << EOF >> ~/.zshrc
      
      # eksworkshop
      export CLUSTER_NAME=myeks
      export VPCID=$(aws ec2 describe-vpcs --filters "Name=tag:Name,Values=$CLUSTER_NAME-VPC" --query 'Vpcs[*].VpcId' --output text)
      export PubSubnet1=$(aws ec2 describe-subnets --filters Name=tag:Name,Values="$CLUSTER_NAME-Vpc1PublicSubnet1" --query "Subnets[0].[SubnetId]" --output text)
      export PubSubnet2=$(aws ec2 describe-subnets --filters Name=tag:Name,Values="$CLUSTER_NAME-Vpc1PublicSubnet2" --query "Subnets[0].[SubnetId]" --output text)
      export PubSubnet3=$(aws ec2 describe-subnets --filters Name=tag:Name,Values="$CLUSTER_NAME-Vpc1PublicSubnet3" --query "Subnets[0].[SubnetId]" --output text)
      export N1=$(aws ec2 describe-instances --filters "Name=tag:Name,Values=$CLUSTER_NAME-ng1-Node" "Name=availability-zone,Values=ap-northeast-2a" --query 'Reservations[*].Instances[*].PublicIpAddress' --output text)
      export N2=$(aws ec2 describe-instances --filters "Name=tag:Name,Values=$CLUSTER_NAME-ng1-Node" "Name=availability-zone,Values=ap-northeast-2b" --query 'Reservations[*].Instances[*].PublicIpAddress' --output text)
      export N3=$(aws ec2 describe-instances --filters "Name=tag:Name,Values=$CLUSTER_NAME-ng1-Node" "Name=availability-zone,Values=ap-northeast-2c" --query 'Reservations[*].Instances[*].PublicIpAddress' --output text)
      export CERT_ARN=$(aws acm list-certificates --query 'CertificateSummaryList[].CertificateArn[]' --output text)
      MyDomain=gasida.link # 각자 자신의 도메인 이름 입력
      MyDnzHostedZoneId=$(aws route53 list-hosted-zones-by-name --dns-name "$MyDomain." --query "HostedZones[0].Id" --output text)
      EOF
      
      # [신규 터미널] 확인
      echo $CLUSTER_NAME $VPCID $PubSubnet1 $PubSubnet2 $PubSubnet3
      echo $N1 $N2 $N3 $MyDomain $MyDnzHostedZoneId
      tail -n 15 ~/.zshrc
    • Windows (WSL2 - Ubuntu) ⇒ 실습 완료 후 삭제 할 것!
      # 변수 지정
      export CLUSTER_NAME=myeks
      export VPCID=$(aws ec2 describe-vpcs --filters "Name=tag:Name,Values=$CLUSTER_NAME-VPC" --query 'Vpcs[*].VpcId' --output text)
      export PubSubnet1=$(aws ec2 describe-subnets --filters Name=tag:Name,Values="$CLUSTER_NAME-Vpc1PublicSubnet1" --query "Subnets[0].[SubnetId]" --output text)
      export PubSubnet2=$(aws ec2 describe-subnets --filters Name=tag:Name,Values="$CLUSTER_NAME-Vpc1PublicSubnet2" --query "Subnets[0].[SubnetId]" --output text)
      export PubSubnet3=$(aws ec2 describe-subnets --filters Name=tag:Name,Values="$CLUSTER_NAME-Vpc1PublicSubnet3" --query "Subnets[0].[SubnetId]" --output text)
      export N1=$(aws ec2 describe-instances --filters "Name=tag:Name,Values=$CLUSTER_NAME-ng1-Node" "Name=availability-zone,Values=ap-northeast-2a" --query 'Reservations[*].Instances[*].PublicIpAddress' --output text)
      export N2=$(aws ec2 describe-instances --filters "Name=tag:Name,Values=$CLUSTER_NAME-ng1-Node" "Name=availability-zone,Values=ap-northeast-2b" --query 'Reservations[*].Instances[*].PublicIpAddress' --output text)
      export N3=$(aws ec2 describe-instances --filters "Name=tag:Name,Values=$CLUSTER_NAME-ng1-Node" "Name=availability-zone,Values=ap-northeast-2c" --query 'Reservations[*].Instances[*].PublicIpAddress' --output text)
      export CERT_ARN=$(aws acm list-certificates --query 'CertificateSummaryList[].CertificateArn[]' --output text) #사용 리전의 인증서 ARN 확인
      MyDomain=gasida.link # 각자 자신의 도메인 이름 입력
      MyDnzHostedZoneId=$(aws route53 list-hosted-zones-by-name --dns-name "$MyDomain." --query "HostedZones[0].Id" --output text)
      
      
      # 실습 완료 후 삭제 할 것!
      cat << EOF >> ~/.bashrc
      
      # eksworkshop
      export CLUSTER_NAME=myeks
      export VPCID=$(aws ec2 describe-vpcs --filters "Name=tag:Name,Values=$CLUSTER_NAME-VPC" --query 'Vpcs[*].VpcId' --output text)
      export PubSubnet1=$(aws ec2 describe-subnets --filters Name=tag:Name,Values="$CLUSTER_NAME-Vpc1PublicSubnet1" --query "Subnets[0].[SubnetId]" --output text)
      export PubSubnet2=$(aws ec2 describe-subnets --filters Name=tag:Name,Values="$CLUSTER_NAME-Vpc1PublicSubnet2" --query "Subnets[0].[SubnetId]" --output text)
      export PubSubnet3=$(aws ec2 describe-subnets --filters Name=tag:Name,Values="$CLUSTER_NAME-Vpc1PublicSubnet3" --query "Subnets[0].[SubnetId]" --output text)
      export N1=$(aws ec2 describe-instances --filters "Name=tag:Name,Values=$CLUSTER_NAME-ng1-Node" "Name=availability-zone,Values=ap-northeast-2a" --query 'Reservations[*].Instances[*].PublicIpAddress' --output text)
      export N2=$(aws ec2 describe-instances --filters "Name=tag:Name,Values=$CLUSTER_NAME-ng1-Node" "Name=availability-zone,Values=ap-northeast-2b" --query 'Reservations[*].Instances[*].PublicIpAddress' --output text)
      export N3=$(aws ec2 describe-instances --filters "Name=tag:Name,Values=$CLUSTER_NAME-ng1-Node" "Name=availability-zone,Values=ap-northeast-2c" --query 'Reservations[*].Instances[*].PublicIpAddress' --output text)
      export CERT_ARN=$(aws acm list-certificates --query 'CertificateSummaryList[].CertificateArn[]' --output text)
      MyDomain=gasida.link # 각자 자신의 도메인 이름 입력
      MyDnzHostedZoneId=$(aws route53 list-hosted-zones-by-name --dns-name "$MyDomain." --query "HostedZones[0].Id" --output text)
      EOF
      
      # [신규 터미널] 확인
      echo $CLUSTER_NAME $VPCID $PubSubnet1 $PubSubnet2 $PubSubnet3
      echo $N1 $N2 $N3 $MyDomain $MyDnzHostedZoneId
      tail -n 15 ~/.bashrc

    0.5. kube-ops-view(Ingress), AWS LoadBalancer Controller, ExternalDNS, gp3 storageclass 설치

    • 설치
      # kube-ops-view
      helm repo add geek-cookbook https://geek-cookbook.github.io/charts/
      helm install kube-ops-view geek-cookbook/kube-ops-view --version 1.2.2 --set service.main.type=ClusterIP  --set env.TZ="Asia/Seoul" --namespace kube-system
      
      # gp3 스토리지 클래스 생성
      cat <<EOF | kubectl apply -f -
      kind: StorageClass
      apiVersion: storage.k8s.io/v1
      metadata:
        name: gp3
        annotations:
          storageclass.kubernetes.io/is-default-class: "true"
      allowVolumeExpansion: true
      provisioner: ebs.csi.aws.com
      volumeBindingMode: WaitForFirstConsumer
      parameters:
        type: gp3
        allowAutoIOPSPerGBIncrease: 'true'
        encrypted: 'true'
        fsType: xfs # 기본값이 ext4
      EOF
      kubectl get sc
      
      # ExternalDNS
      curl -s https://raw.githubusercontent.com/gasida/PKOS/main/aews/externaldns.yaml | MyDomain=$MyDomain MyDnzHostedZoneId=$MyDnzHostedZoneId envsubst | kubectl apply -f -
      
      # AWS LoadBalancerController
      helm repo add eks https://aws.github.io/eks-charts
      helm install aws-load-balancer-controller eks/aws-load-balancer-controller -n kube-system --set clusterName=$CLUSTER_NAME \
        --set serviceAccount.create=false --set serviceAccount.name=aws-load-balancer-controller
      
      # kubeopsview 용 Ingress 설정 : group 설정으로 1대의 ALB를 여러개의 ingress 에서 공용 사용
      cat <<EOF | kubectl apply -f -
      apiVersion: networking.k8s.io/v1
      kind: Ingress
      metadata:
        annotations:
          alb.ingress.kubernetes.io/certificate-arn: $CERT_ARN
          alb.ingress.kubernetes.io/group.name: study
          alb.ingress.kubernetes.io/listen-ports: '[{"HTTPS":443}, {"HTTP":80}]'
          alb.ingress.kubernetes.io/load-balancer-name: $CLUSTER_NAME-ingress-alb
          alb.ingress.kubernetes.io/scheme: internet-facing
          alb.ingress.kubernetes.io/ssl-redirect: "443"
          alb.ingress.kubernetes.io/success-codes: 200-399
          alb.ingress.kubernetes.io/target-type: ip
        labels:
          app.kubernetes.io/name: kubeopsview
        name: kubeopsview
        namespace: kube-system
      spec:
        ingressClassName: alb
        rules:
        - host: kubeopsview.$MyDomain
          http:
            paths:
            - backend:
                service:
                  name: kube-ops-view
                  port:
                    number: 8080
              path: /
              pathType: Prefix
      EOF
      
    • 확인
      # 설치된 파드 정보 확인
      kubectl get pods -n kube-system
      
      # service, ep, ingress 확인
      kubectl get ingress,svc,ep -n kube-system
      
      # Kube Ops View 접속 정보 확인 
      echo -e "Kube Ops View URL = https://kubeopsview.$MyDomain/#scale=1.5"
      open "https://kubeopsview.$MyDomain/#scale=1.5" # macOS

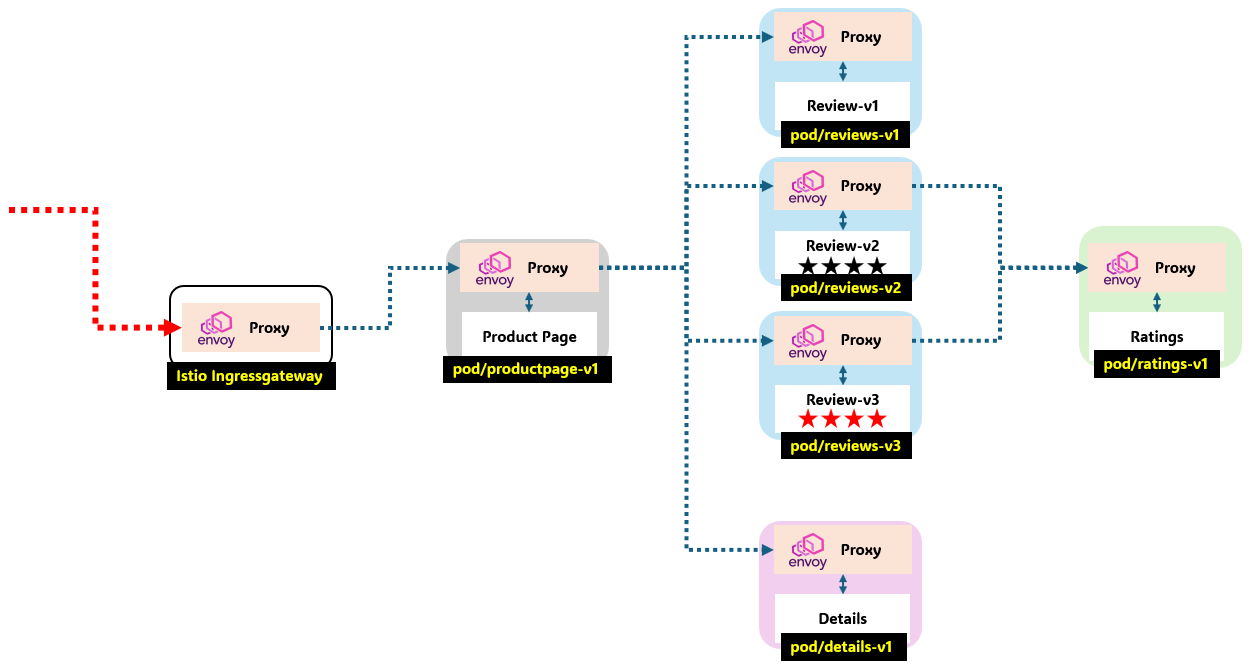
    0.6. Bookinfo 애플리케이션 배포

    • Bookinfo 애플리케이션 배포 - 링크 , Github
      # 모니터링
      watch -d 'kubectl get pod -o wide;echo;kubectl get svc'
      
      # Bookinfo 애플리케이션 배포
      kubectl apply -f https://raw.githubusercontent.com/istio/istio/refs/heads/master/samples/bookinfo/platform/kube/bookinfo.yaml
      
      # 확인
      kubectl get all,sa
      
      # product 웹 접속 확인
      kubectl exec "$(kubectl get pod -l app=ratings -o jsonpath='{.items[0].metadata.name}')" -c ratings -- curl -sS productpage:9080/productpage | grep -o "<title>.*</title>"
      
      # 로그
      kubectl stern -l app=productpage
      혹은
      kubectl log -l app=productpage -f


    • productpage 접속(반복) 테스트 & 웹 브라우저 접속
      • Ingress(ALB) 설정
        #
        cat <<EOF | kubectl apply -f -
        apiVersion: networking.k8s.io/v1
        kind: Ingress
        metadata:
          annotations:
            alb.ingress.kubernetes.io/certificate-arn: $CERT_ARN
            alb.ingress.kubernetes.io/group.name: study
            alb.ingress.kubernetes.io/listen-ports: '[{"HTTPS":443}, {"HTTP":80}]'
            alb.ingress.kubernetes.io/load-balancer-name: $CLUSTER_NAME-ingress-alb
            alb.ingress.kubernetes.io/scheme: internet-facing
            alb.ingress.kubernetes.io/ssl-redirect: "443"
            alb.ingress.kubernetes.io/success-codes: 200-399
            alb.ingress.kubernetes.io/target-type: ip
          labels:
            app.kubernetes.io/name: bookinfo
          name: bookinfo
        spec:
          ingressClassName: alb
          rules:
          - host: bookinfo.$MyDomain
            http:
              paths:
              - backend:
                  service:
                    name: productpage
                    port:
                      number: 9080
                path: /
                pathType: Prefix
        EOF
        kubectl get ingress
        
        # bookinfo 접속 정보 확인 
        echo -e "bookinfo URL = https://bookinfo.$MyDomain/productpage"
        open "https://bookinfo.$MyDomain/productpage" # macOS
        
      • 반복 접속 실행
        # 반복 접속 실행
        curl -s -k https://bookinfo.$MyDomain/productpage | grep -o "<title>.*</title>"
        while true; do curl -s -k https://bookinfo.$MyDomain/productpage | grep -o "<title>.*</title>" ; echo "--------------" ; sleep 1; done
        for i in {1..100};  do curl -s -k https://bookinfo.$MyDomain/productpage | grep -o "<title>.*</title>" ; done
        
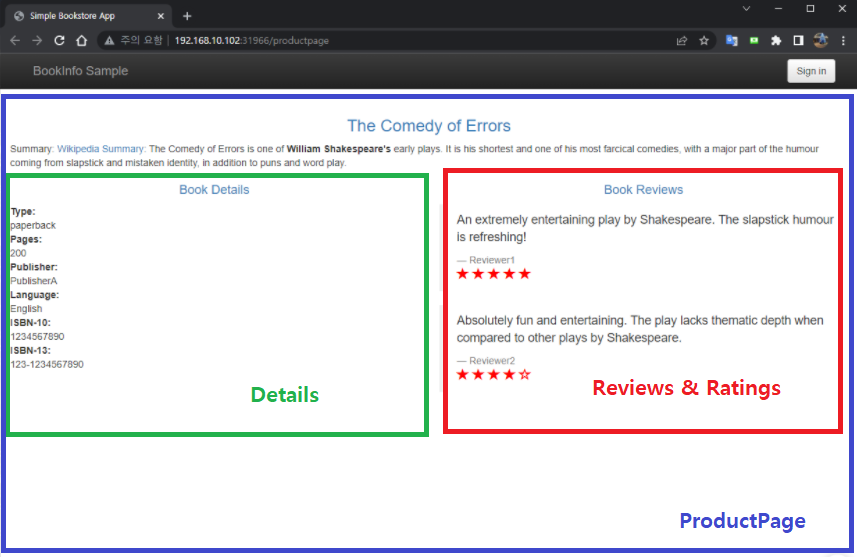
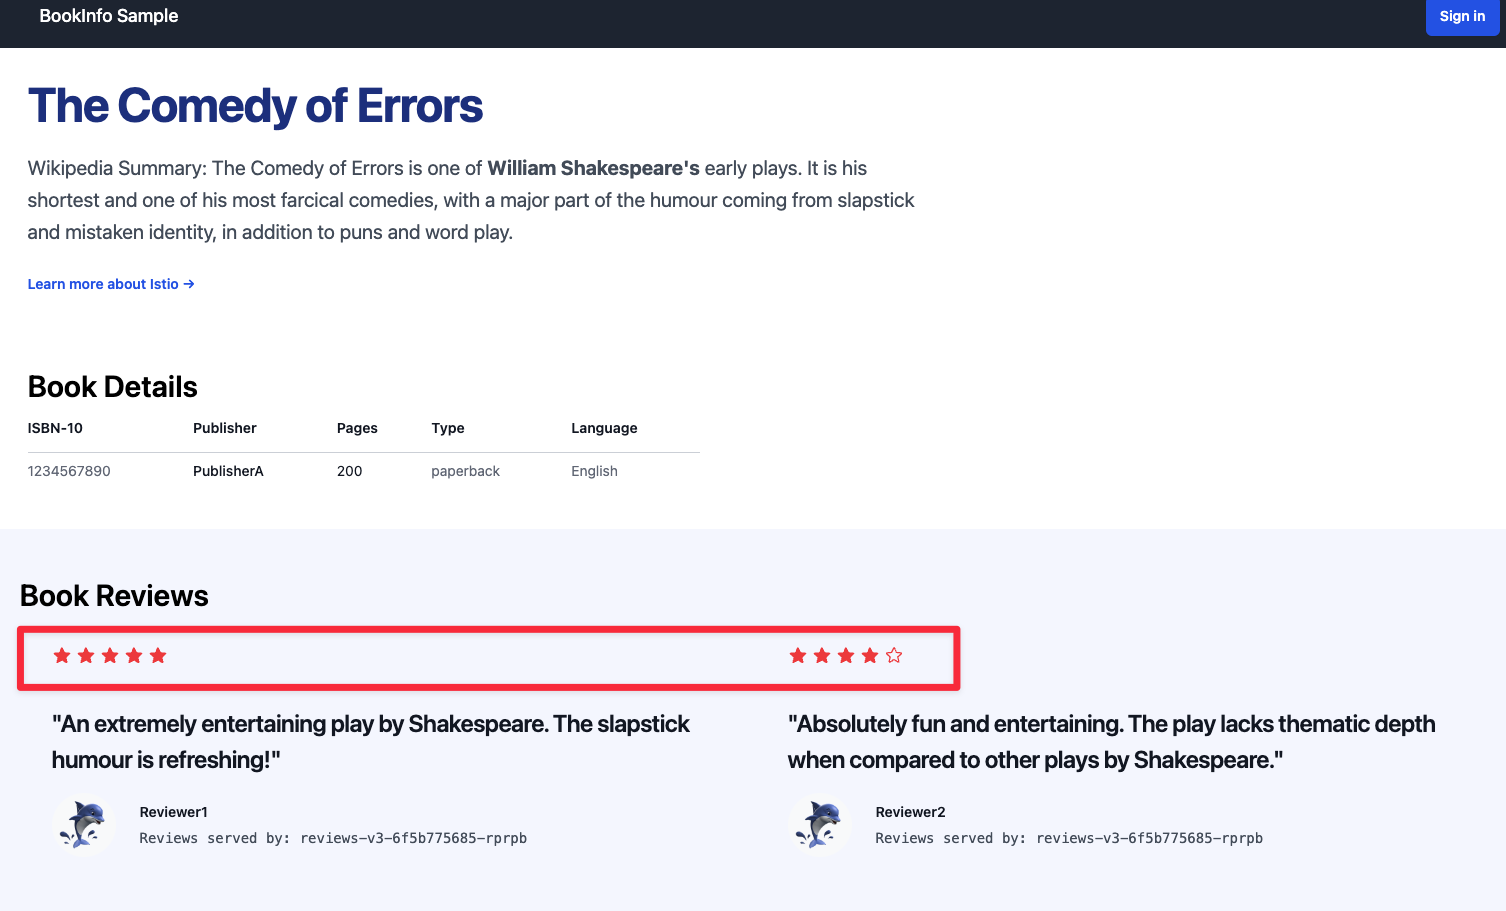
      • 자신의 PC 웹 브라우저를 통해서 https://bookinfo.$MyDomain/productpage 로 접속 후 새로고침 → ReviewsRatings 변경 확인!
      새로고침으로Reviews
      Ratings변경
      확인! 별점 부분 변경 확인!


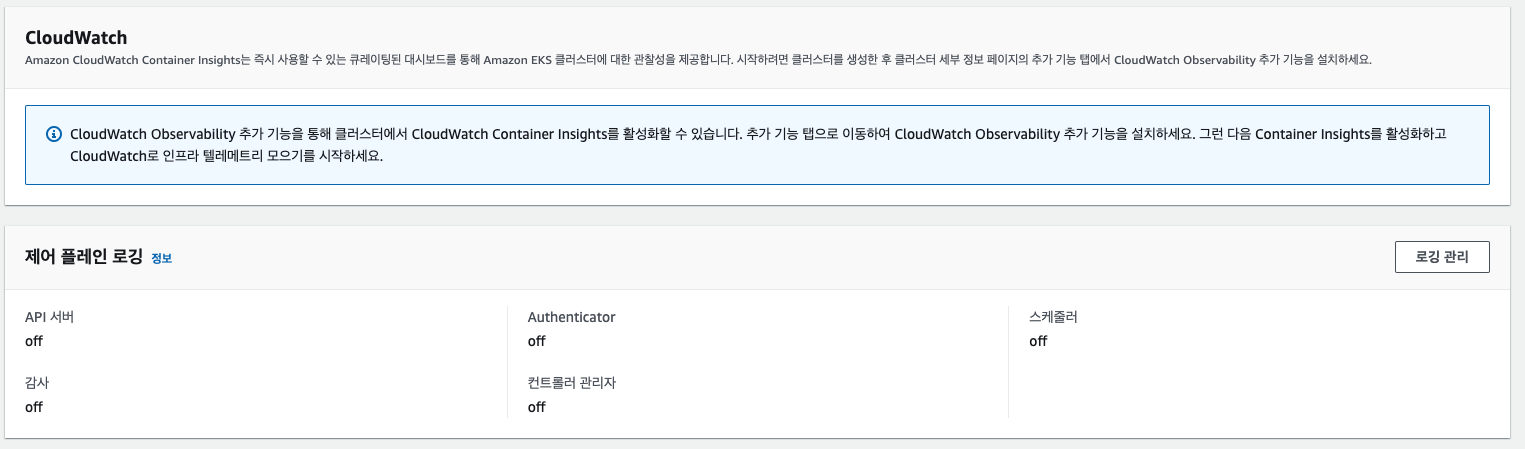
    1. Logging in EKS - control plane logging, node logging, and application logging - Docs1.1. Control Plane logging : 로그 이름( /aws/eks/<cluster-name>/cluster ) - Docs
      1. Kubernetes API server component logs (api) – kube-apiserver-<nnn...>
      1. Audit (audit) – kube-apiserver-audit-<nnn...>
      1. Authenticator (authenticator) – authenticator-<nnn...>
      1. Controller manager (controllerManager) – kube-controller-manager-<nnn...>
      1. Scheduler (scheduler) – kube-scheduler-<nnn...>
      # 모든 로깅 활성화
      aws eks update-cluster-config --region ap-northeast-2 --name $CLUSTER_NAME \
          --logging '{"clusterLogging":[{"types":["api","audit","authenticator","controllerManager","scheduler"],"enabled":true}]}'
      
      # 로그 그룹 확인
      aws logs describe-log-groups | jq
      
      # 로그 tail 확인 : aws logs tail help
      aws logs tail /aws/eks/$CLUSTER_NAME/cluster | more
      
      # 신규 로그를 바로 출력
      aws logs tail /aws/eks/$CLUSTER_NAME/cluster --follow
      
      # 필터 패턴
      aws logs tail /aws/eks/$CLUSTER_NAME/cluster --filter-pattern <필터 패턴>
      
      # 로그 스트림이름
      aws logs tail /aws/eks/$CLUSTER_NAME/cluster --log-stream-name-prefix <로그 스트림 prefix> --follow
      aws logs tail /aws/eks/$CLUSTER_NAME/cluster --log-stream-name-prefix kube-apiserver --follow
      aws logs tail /aws/eks/$CLUSTER_NAME/cluster --log-stream-name-prefix kube-apiserver-audit --follow
      aws logs tail /aws/eks/$CLUSTER_NAME/cluster --log-stream-name-prefix kube-scheduler --follow
      aws logs tail /aws/eks/$CLUSTER_NAME/cluster --log-stream-name-prefix authenticator --follow
      aws logs tail /aws/eks/$CLUSTER_NAME/cluster --log-stream-name-prefix kube-controller-manager --follow
      aws logs tail /aws/eks/$CLUSTER_NAME/cluster --log-stream-name-prefix cloud-controller-manager --follow
      kubectl scale deployment -n kube-system coredns --replicas=1
      kubectl scale deployment -n kube-system coredns --replicas=2
      
      # 시간 지정: 1초(s) 1분(m) 1시간(h) 하루(d) 한주(w)
      aws logs tail /aws/eks/$CLUSTER_NAME/cluster --since 1h30m
      
      # 짧게 출력
      aws logs tail /aws/eks/$CLUSTER_NAME/cluster --since 1h30m --format short
      • CloudWatch Log Insights : 로그 그룹 선택 후 Run query - 링크
      # EC2 Instance가 NodeNotReady 상태인 로그 검색
      fields @timestamp, @message
      | filter @message like /NodeNotReady/
      | sort @timestamp desc
      
      # kube-apiserver-audit 로그에서 userAgent 정렬해서 아래 4개 필드 정보 검색
      fields userAgent, requestURI, @timestamp, @message
      | filter @logStream ~= "kube-apiserver-audit"
      | stats count(userAgent) as count by userAgent
      | sort count desc
      
      #
      fields @timestamp, @message
      | filter @logStream ~= "kube-scheduler"
      | sort @timestamp desc
      
      #
      fields @timestamp, @message
      | filter @logStream ~= "authenticator"
      | sort @timestamp desc
      
      #
      fields @timestamp, @message
      | filter @logStream ~= "kube-controller-manager"
      | sort @timestamp desc
      • CloudWatch Log Insight Query with AWS CLI
      # CloudWatch Log Insight Query
      aws logs get-query-results --query-id $(aws logs start-query \
      --log-group-name '/aws/eks/myeks/cluster' \
      --start-time `date -d "-1 hours" +%s` \
      --end-time `date +%s` \
      --query-string 'fields @timestamp, @message | filter @logStream ~= "kube-scheduler" | sort @timestamp desc' \
      | jq --raw-output '.queryId')
      • 로깅 끄기
      # EKS Control Plane 로깅(CloudWatch Logs) 비활성화
      eksctl utils update-cluster-logging --cluster $CLUSTER_NAME --region ap-northeast-2 --disable-types all --approve
      
      # 로그 그룹 삭제
      aws logs delete-log-group --log-group-name /aws/eks/$CLUSTER_NAME/cluster
      1.1.1. Control Plane metrics with Prometheus & CW Logs Insights 쿼리 - Docs
      # 메트릭 패턴 정보 : metric_name{"tag"="value"[,...]} value
      kubectl get --raw /metrics | more
      • Managing etcd database size on Amazon EKS clusters - 링크
      # How to monitor etcd database size?
      kubectl get --raw /metrics | grep "apiserver_storage_size_bytes"
      apiserver_storage_size_bytes{cluster="etcd-0"} 4.919296e+06
      
      # CW Logs Insights 쿼리
      fields @timestamp, @message, @logStream
      | filter @logStream like /kube-apiserver-audit/
      | filter @message like /mvcc: database space exceeded/
      | limit 10
      
      # How do I identify what is consuming etcd database space?
      kubectl get --raw=/metrics | grep apiserver_storage_objects |awk '$2>100' |sort -g -k 2
      kubectl get --raw=/metrics | grep apiserver_storage_objects |awk '$2>50' |sort -g -k 2
      apiserver_storage_objects{resource="clusterrolebindings.rbac.authorization.k8s.io"} 78
      apiserver_storage_objects{resource="clusterroles.rbac.authorization.k8s.io"} 92
      
      # CW Logs Insights 쿼리 : Request volume - Requests by User Agent:
      fields userAgent, requestURI, @timestamp, @message
      | filter @logStream like /kube-apiserver-audit/
      | stats count(*) as count by userAgent
      | sort count desc
      
      # CW Logs Insights 쿼리 : Request volume - Requests by Universal Resource Identifier (URI)/Verb:
      filter @logStream like /kube-apiserver-audit/
      | stats count(*) as count by requestURI, verb, user.username
      | sort count desc
      
      # Object revision updates
      fields requestURI
      | filter @logStream like /kube-apiserver-audit/
      | filter requestURI like /pods/
      | filter verb like /patch/
      | filter count > 8
      | stats count(*) as count by requestURI, responseStatus.code
      | filter responseStatus.code not like /500/
      | sort count desc
      
      #
      fields @timestamp, userAgent, responseStatus.code, requestURI
      | filter @logStream like /kube-apiserver-audit/
      | filter requestURI like /pods/
      | filter verb like /patch/
      | filter requestURI like /name_of_the_pod_that_is_updating_fast/
      | sort @timestamp
      

    1.2. Container(Pod) Logging

    1.2.1. NGINX 웹서버 배포 with Ingress(ALB) - Helm , resourcePreset

    # NGINX 웹서버 배포
    helm repo add bitnami https://charts.bitnami.com/bitnami
    helm repo update
    
    # 도메인, 인증서 확인
    echo $MyDomain $CERT_ARN
    
    # 파라미터 파일 생성
    cat <<EOT > nginx-values.yaml
    service:
      type: NodePort
      
    networkPolicy:
      enabled: false
      
    resourcesPreset: "nano"
    
    ingress:
      enabled: true
      ingressClassName: alb
      hostname: nginx.$MyDomain
      pathType: Prefix
      path: /
      annotations: 
        alb.ingress.kubernetes.io/certificate-arn: $CERT_ARN
        alb.ingress.kubernetes.io/group.name: study
        alb.ingress.kubernetes.io/listen-ports: '[{"HTTPS":443}, {"HTTP":80}]'
        alb.ingress.kubernetes.io/load-balancer-name: $CLUSTER_NAME-ingress-alb
        alb.ingress.kubernetes.io/scheme: internet-facing
        alb.ingress.kubernetes.io/ssl-redirect: "443"
        alb.ingress.kubernetes.io/success-codes: 200-399
        alb.ingress.kubernetes.io/target-type: ip
    EOT
    cat nginx-values.yaml
    
    # 배포
    helm install nginx bitnami/nginx --version 19.0.0 -f nginx-values.yaml
    
    # 확인
    kubectl get ingress,deploy,svc,ep nginx
    kubectl describe deploy nginx # Resource - Limits/Requests 확인
    kubectl get targetgroupbindings # ALB TG 확인
    
    # 접속 주소 확인 및 접속
    echo -e "Nginx WebServer URL = https://nginx.$MyDomain"
    curl -s https://nginx.$MyDomain
    kubectl stern deploy/nginx
    혹은
    kubectl logs deploy/nginx -f
    
    # 반복 접속
    while true; do curl -s https://nginx.$MyDomain | grep title; date; sleep 1; done
    while true; do curl -s https://nginx.$MyDomain -I | head -n 1; date; sleep 1; done
    • (참고) 외부에서는 접속이 잘되나, 운영서버 EC2에서 curl 접속이 잘 되지 않을 경우
      dig +short nginx.$MyDomain
      dig +short nginx.$MyDomain @172.20.0.2
      dig +short nginx.$MyDomain @1.1.1.1
      dig +short nginx.$MyDomain @8.8.8.8
      cat /etc/resolv.conf
      sed -i "s/^nameserver 172.20.0.2/nameserver 1.1.1.1/g" /etc/resolv.conf
      cat /etc/resolv.conf
      dig +short nginx.$MyDomain
      dig +short nginx.$MyDomain @8.8.8.8
      dig +short nginx.$MyDomain @172.20.0.2
      curl -s https://nginx.$MyDomain

    1.2.2. 컨테이너 로그 환경의 로그는 표준 출력

    stdout

    과 표준 에러

    stderr

    로 보내는 것을 권고 - 링크

    • 해당 권고에 따라 작성된 컨테이너 애플리케이션의 로그는 해당 파드 안으로 접속하지 않아도 사용자는 외부에서 kubectl logs 명령어로 애플리케이션 종류에 상관없이,
      애플리케이션마다 로그 파일 위치에 상관없이, 단일 명령어로 조회 가능
      # 로그 모니터링
      kubectl stern deploy/nginx
      혹은
      kubectl logs deploy/nginx -f
      
      # nginx 웹 접속 시도
      
      # 컨테이너 로그 파일 위치 확인
      kubectl exec -it deploy/nginx -- ls -l /opt/bitnami/nginx/logs/
      
      Defaulted container "nginx" out of: nginx, preserve-logs-symlinks (init)
      total 0
      lrwxrwxrwx. 1 1001 1001 11 Mar  1 04:17 access.log -> /dev/stdout
      lrwxrwxrwx. 1 1001 1001 11 Mar  1 04:17 error.log -> /dev/stderr
    • (참고) nginx docker log collector 예시 - 링크 링크
      RUN ln -sf /dev/stdout /opt/bitnami/nginx/logs/access.log
      RUN ln -sf /dev/stderr /opt/bitnami/nginx/logs/error.log
      # forward request and error logs to docker log collector
      RUN ln -sf /dev/stdout /var/log/nginx/access.log \
       && ln -sf /dev/stderr /var/log/nginx/error.log
      • 또한 종료된 파드의 로그는 kubectl logs로 조회 할 수 없다


    • kubelet 기본 설정은 로그 파일의 최대 크기가 10Mi로 10Mi를 초과하는 로그는 전체 로그 조회가 불가능함 (파일 갯수 5개)
      # AL2 경우
      cat /etc/kubernetes/kubelet-config.yaml
      ...
      containerLogMaxSize: 10Mi
      • kubelet 구성 파일 경로 : --config-dir=/etc/kubernetes/kubelet.conf.d - Docs , Ref
      • AL2023에서는 설정 방법 변경 - Docs ( containerLogMaxSize , containerLogMaxFiles , containerLogMaxWorkers )
    • (참고) AL2023 수정 - Github , awslabs
      • AL2023 Node Config 수정 with Terraform - Blog
    • (참고) AL2 수정 예시 - 링크 , Docs
      apiVersion: eksctl.io/v1alpha5
      kind: ClusterConfig
      
      metadata:
        name: <cluster-name>
        region: eu-central-1
      
      nodeGroups:
        - name: worker-spot-containerd-large-log
          labels: { instance-type: spot }
          instanceType: t3.large
          minSize: 2
          maxSize: 30
          desiredCapacity: 2
          amiFamily: AmazonLinux2
          containerRuntime: containerd
          availabilityZones: ["eu-central-1a", "eu-central-1b", "eu-central-1c"]
          kubeletExtraConfig:
            containerLogMaxSize: "50Mi"
            containerLogMaxFiles: 10


    1. Container Insights metrics in Amazon CloudWatch & Fluent Bit (Logs)

    CCI CloudWatch Container Insights(or Obserbavility) : 노드에 CW Agent 파드Fluent Bit 파드데몬셋으로 배치되어 MetricsLogs 수집 - Blog

    2.1. Fluent Bit

    (as a DaemonSet to send logs to CloudWatch Logs)

    Integration in CloudWatch Container Insights for EKS - Docs Blog Fluentd TS , Workshop1 , Workshop2

    • [수집] 플루언트비트 Fluent Bit 컨테이너를 데몬셋으로 동작시키고, 아래 3가지 종류의 로그CloudWatch Logs 에 전송
      1. /aws/containerinsights/Cluster_Name/application : 로그 소스(All log files in /var/log/containers), 각 컨테이너/파드 로그
      1. /aws/containerinsights/Cluster_Name/host : 로그 소스(Logs from /var/log/dmesg/var/log/secure, and /var/log/messages), 노드(호스트) 로그
      1. /aws/containerinsights/Cluster_Name/dataplane : 로그 소스(/var/log/journal for kubelet.servicekubeproxy.service, and docker.service), 쿠버네티스 데이터플레인 로그
    • [저장] : CloudWatch Logs 에 로그를 저장, 로그 그룹 별 로그 보존 기간 설정 가능
    • [시각화] : CloudWatch 의 Logs Insights 를 사용하여 대상 로그를 분석하고, CloudWatch 의 대시보드로 시각화한다
    • (참고) Fluent Bit is a lightweight log processor and forwarder that allows you to collect data and logs from different sources, enrich them with filters and send them to multiple destinations like CloudWatch, Kinesis Data Firehose, Kinesis Data Streams and Amazon OpenSearch Service.


    2.2. CCI 소개 : collect, aggregate, and summarize metrics and logs from your containerized applications and microservices - 링크 Docs

    • CloudWatch Container Insight는 컨테이너형 애플리케이션마이크로 서비스에 대한 모니터링, 트러블 슈팅알람을 위한 완전 관리형 관측 서비스입니다.
    • CloudWatch 콘솔에서 자동화된 대시보드를 통해 container metrics, Prometeus metrics, application logs 및 performance log events를 탐색, 분석 및 시각화할 수 있습니다.
    • CloudWatch Container Insight는 CPU, 메모리, 디스크 및 네트워크와 같은 인프라 메트릭을 자동으로 수집합니다.
    • EKS 클러스터의 crashloop backoffs와 같은 진단 정보를 제공하여 문제를 격리하고 신속하게 해결할 수 있도록 지원합니다.
    • 이러한 대시보드는 Amazon ECS, Amazon EKS, AWS ECS Fargate 그리고 EC2 위에 구동되는 k8s 클러스터에서 사용 가능합니다.


    2.3. CloudWatch Container Insight(observability) 설치 - Docs , Link cloudwatch-agent & fluent-bit - 링크 & Setting up Fluent Bit - Docs

    2.3.1. (사전 확인) 노드의 로그 확인

    1. application 로그 소스(All log files in /var/log/containers → 심볼릭 링크 /var/log/pods/<컨테이너>, 각 컨테이너/파드 로그
      # 로그 위치 확인
      #ssh ec2-user@$N1 sudo tree /var/log/containers
      #ssh ec2-user@$N1 sudo ls -al /var/log/containers
      for node in $N1 $N2 $N3; do echo ">>>>> $node <<<<<"; ssh ec2-user@$node sudo tree /var/log/containers; echo; done
      for node in $N1 $N2 $N3; do echo ">>>>> $node <<<<<"; ssh ec2-user@$node sudo ls -al /var/log/containers; echo; done
      
      # 개별 파드 로그 확인 : 아래 각자 디렉터리 경로는 다름
      ssh ec2-user@$N1 sudo tail -f /var/log/pods/default_nginx-685c67bc9-pkvzd_69b28caf-7fe2-422b-aad8-f1f70a206d9e/nginx/0.log
    1. host 로그 소스(Logs from /var/log/dmesg/var/log/secure, and /var/log/messages), 노드(호스트) 로그
      # 로그 위치 확인
      #ssh ec2-user@$N1 sudo tree /var/log/ -L 1
      #ssh ec2-user@$N1 sudo ls -la /var/log/
      for node in $N1 $N2 $N3; do echo ">>>>> $node <<<<<"; ssh ec2-user@$node sudo tree /var/log/ -L 1; echo; done
      for node in $N1 $N2 $N3; do echo ">>>>> $node <<<<<"; ssh ec2-user@$node sudo ls -la /var/log/; echo; done
      
      # 호스트 로그 확인
      #ssh ec2-user@$N1 sudo tail /var/log/dmesg
      #ssh ec2-user@$N1 sudo tail /var/log/secure
      #ssh ec2-user@$N1 sudo tail /var/log/messages
      for log in dmesg secure messages; do echo ">>>>> Node1: /var/log/$log <<<<<"; ssh ec2-user@$N1 sudo tail /var/log/$log; echo; done
      for log in dmesg secure messages; do echo ">>>>> Node2: /var/log/$log <<<<<"; ssh ec2-user@$N2 sudo tail /var/log/$log; echo; done
      for log in dmesg secure messages; do echo ">>>>> Node3: /var/log/$log <<<<<"; ssh ec2-user@$N3 sudo tail /var/log/$log; echo; done
    1. dataplane 로그 소스(/var/log/journal for kubelet.servicekubeproxy.service, and docker.service), 쿠버네티스 데이터플레인 로그
      # 로그 위치 확인
      #ssh ec2-user@$N1 sudo tree /var/log/journal -L 1
      #ssh ec2-user@$N1 sudo ls -la /var/log/journal
      for node in $N1 $N2 $N3; do echo ">>>>> $node <<<<<"; ssh ec2-user@$node sudo tree /var/log/journal -L 1; echo; done
      
      # 저널 로그 확인 - 링크
      ssh ec2-user@$N3 sudo journalctl -x -n 200
      ssh ec2-user@$N3 sudo journalctl -f

    2.3.2. CCI 설치

    # IRSA 설정
    eksctl create iamserviceaccount \
      --name cloudwatch-agent \
      --namespace amazon-cloudwatch --cluster $CLUSTER_NAME \
      --role-name $CLUSTER_NAME-cloudwatch-agent-role \
      --attach-policy-arn arn:aws:iam::aws:policy/CloudWatchAgentServerPolicy \
      --role-only \
      --approve
    
    # addon 배포
    aws eks create-addon --addon-name amazon-cloudwatch-observability --cluster-name $CLUSTER_NAME --service-account-role-arn arn:aws:iam::$ACCOUNT_ID\:role/$CLUSTER_NAME-cloudwatch-agent-role
    
    # addon 확인
    aws eks list-addons --cluster-name myeks --output table
    
    
    # 설치 확인
    kubectl get crd | grep -i cloudwatch
    kubectl get-all -n amazon-cloudwatch
    kubectl get ds,pod,cm,sa,amazoncloudwatchagent -n amazon-cloudwatch
    kubectl describe clusterrole cloudwatch-agent-role amazon-cloudwatch-observability-manager-role    # 클러스터롤 확인
    kubectl describe clusterrolebindings cloudwatch-agent-role-binding amazon-cloudwatch-observability-manager-rolebinding  # 클러스터롤 바인딩 확인
    kubectl -n amazon-cloudwatch logs -l app.kubernetes.io/component=amazon-cloudwatch-agent -f # 파드 로그 확인
    kubectl -n amazon-cloudwatch logs -l k8s-app=fluent-bit -f    # 파드 로그 확인
    
    # cloudwatch-agent 설정 확인
    kubectl describe cm cloudwatch-agent -n amazon-cloudwatch
    kubectl get cm cloudwatch-agent -n amazon-cloudwatch -o jsonpath="{.data.cwagentconfig\.json}" | jq
    {
      "agent": {
        "region": "ap-northeast-2"
      },
      "logs": {
        "metrics_collected": {
          "application_signals": {
            "hosted_in": "myeks"
          },
          "kubernetes": {
            "cluster_name": "myeks",
            "enhanced_container_insights": true
          }
        }
      },
      "traces": {
        "traces_collected": {
          "application_signals": {}
        }
      }
    }
    
    #Fluent bit 파드 수집하는 방법 : Volumes에 HostPath를 살펴보자! >> / 호스트 패스 공유??? 보안상 안전한가? 좀 더 범위를 좁힐수는 없을까요? 
    kubectl describe -n amazon-cloudwatch ds cloudwatch-agent
    ...
      Volumes:
       ...
       rootfs:
        Type:          HostPath (bare host directory volume)
        Path:          /
        HostPathType:  
    
    
    # Fluent Bit 로그 INPUT/FILTER/OUTPUT 설정 확인 - 링크
    ## 설정 부분 구성 : application-log.conf , dataplane-log.conf , fluent-bit.conf , host-log.conf , parsers.conf
    kubectl describe cm fluent-bit-config -n amazon-cloudwatch
    ...
    application-log.conf:
    ----
    [INPUT]
        Name                tail
        Tag                 application.*
        Exclude_Path        /var/log/containers/cloudwatch-agent*, /var/log/containers/fluent-bit*, /var/log/containers/aws-node*, /var/log/containers/kube-proxy*
        Path                /var/log/containers/*.log
        multiline.parser    docker, cri
        DB                  /var/fluent-bit/state/flb_container.db
        Mem_Buf_Limit       50MB
        Skip_Long_Lines     On
        Refresh_Interval    10
        Rotate_Wait         30
        storage.type        filesystem
        Read_from_Head      ${READ_FROM_HEAD}
    ...
    
    [FILTER]
        Name                kubernetes
        Match               application.*
        Kube_URL            https://kubernetes.default.svc:443
        Kube_Tag_Prefix     application.var.log.containers.
        Merge_Log           On
        Merge_Log_Key       log_processed
        K8S-Logging.Parser  On
        K8S-Logging.Exclude Off
        Labels              Off
        Annotations         Off
        Use_Kubelet         On
        Kubelet_Port        10250
        Buffer_Size         0
    
    [OUTPUT]
        Name                cloudwatch_logs
        Match               application.*
        region              ${AWS_REGION}
        log_group_name      /aws/containerinsights/${CLUSTER_NAME}/application
        log_stream_prefix   ${HOST_NAME}-
        auto_create_group   true
        extra_user_agent    container-insights
    ...
    
    # Fluent Bit 파드가 수집하는 방법 : Volumes에 HostPath를 살펴보자!
    kubectl describe -n amazon-cloudwatch ds fluent-bit
    ...
    ssh ec2-user@$N1 sudo tree /var/log
    ssh ec2-user@$N2 sudo tree /var/log
    ssh ec2-user@$N3 sudo tree /var/log
    • Fluent bit 파드가 수집하는 방법 : Volumes에 HostPath - 링크
      • host에서 사용하는 docker.sock가 Pod에 mount 되어있는 상태에서 악의적인 사용자가 해당 Pod에 docker만 설치할 수 있다면, mount된 dock.sock을 이용하여 host의 docker에 명령을 보낼 수 있게 된다(docker가 client-server 구조이기 때문에 가능).이는 container escape라고도 할 수 있다.
    • 로깅 확인 : CW → 로그 그룹
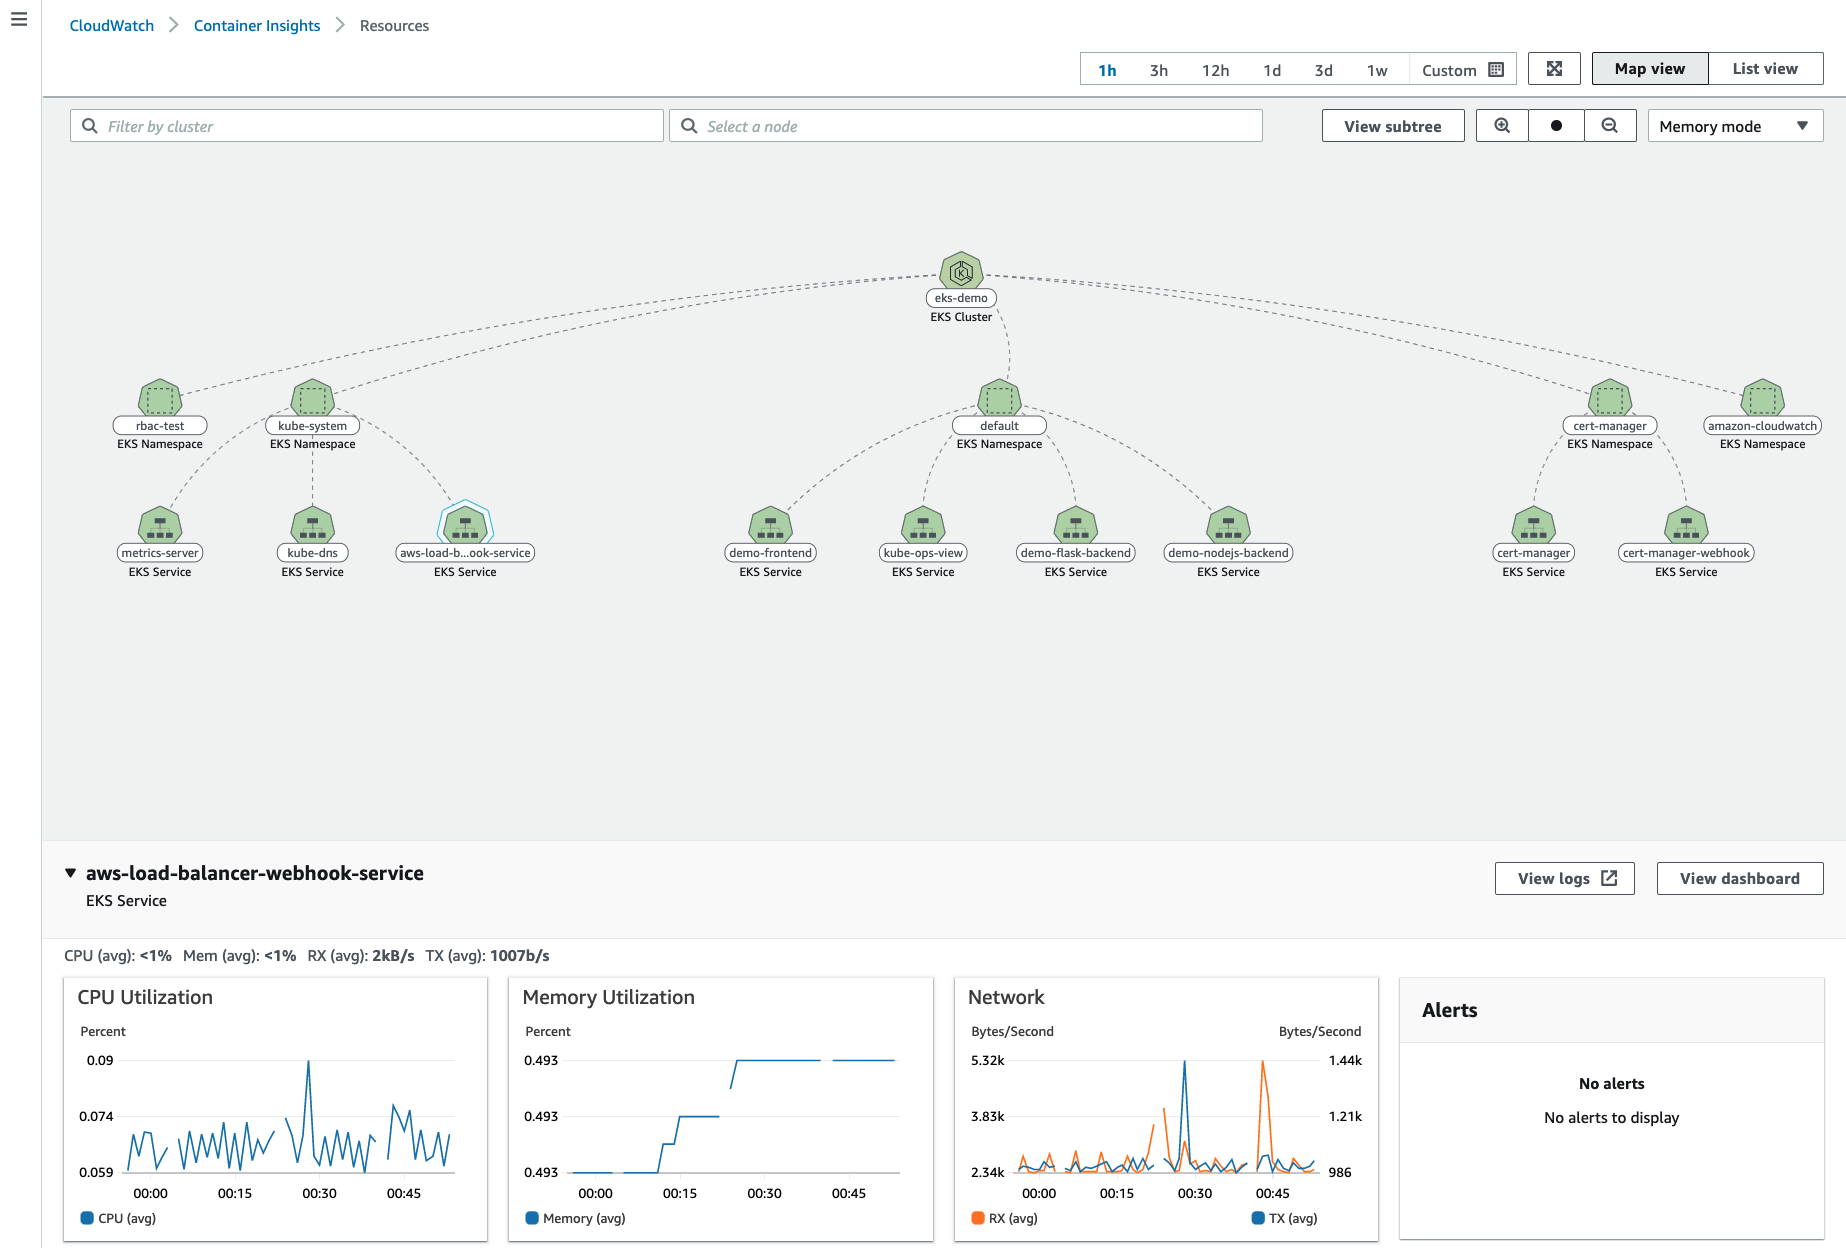
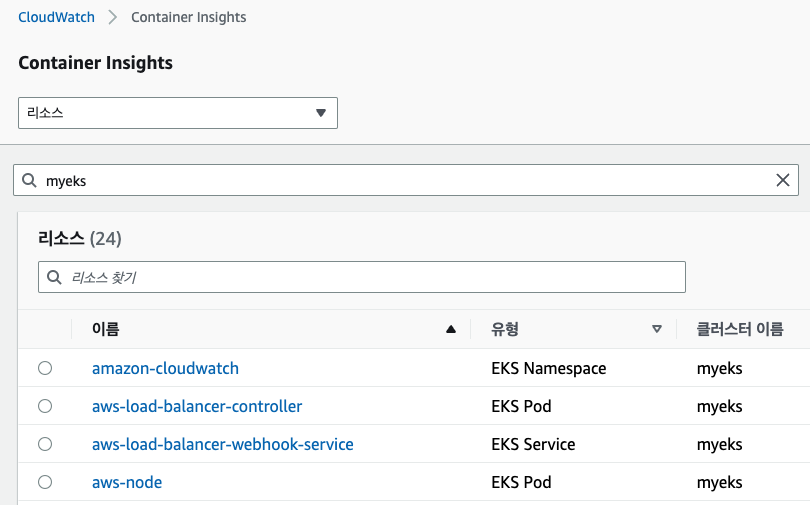
    • 메트릭 확인 : CW → 인사이트 → Container Insights

    2.3.3. [운영 서버 EC2] 로그 확인 : nginx 웹서버 - Docs

    # 부하 발생
    curl -s https://nginx.$MyDomain
    yum install -y httpd
    ab -c 500 -n 30000 https://nginx.$MyDomain/
    
    # 파드 직접 로그 모니터링
    kubectl stern deploy/nginx
    • 로그 그룹 - Linkapplication → 로그 스트림 : nginx 필터링 ⇒ 클릭 후 확인 ⇒ ApacheBench 필터링 확인
    • Logs Insights - Link
    # Application log errors by container name : 컨테이너 이름별 애플리케이션 로그 오류
    # 로그 그룹 선택 : /aws/containerinsights/<CLUSTER_NAME>/application
    stats count() as error_count by kubernetes.container_name 
    | filter stream="stderr" 
    | sort error_count desc
    
    # All Kubelet errors/warning logs for for a given EKS worker node
    # 로그 그룹 선택 : /aws/containerinsights/<CLUSTER_NAME>/dataplane
    fields @timestamp, @message, ec2_instance_id
    | filter  message =~ /.*(E|W)[0-9]{4}.*/ and ec2_instance_id="<YOUR INSTANCE ID>"
    | sort @timestamp desc
    
    # Kubelet errors/warning count per EKS worker node in the cluster
    # 로그 그룹 선택 : /aws/containerinsights/<CLUSTER_NAME>/dataplane
    fields @timestamp, @message, ec2_instance_id
    | filter   message =~ /.*(E|W)[0-9]{4}.*/
    | stats count(*) as error_count by ec2_instance_id
    
    # performance 로그 그룹
    # 로그 그룹 선택 : /aws/containerinsights/<CLUSTER_NAME>/performance
    # 노드별 평균 CPU 사용률
    STATS avg(node_cpu_utilization) as avg_node_cpu_utilization by NodeName
    | SORT avg_node_cpu_utilization DESC
    
    # 파드별 재시작(restart) 카운트
    STATS avg(number_of_container_restarts) as avg_number_of_container_restarts by PodName
    | SORT avg_number_of_container_restarts DESC
    
    # 요청된 Pod와 실행 중인 Pod 간 비교
    fields @timestamp, @message 
    | sort @timestamp desc 
    | filter Type="Pod" 
    | stats min(pod_number_of_containers) as requested, min(pod_number_of_running_containers) as running, ceil(avg(pod_number_of_containers-pod_number_of_running_containers)) as pods_missing by kubernetes.pod_name 
    | sort pods_missing desc
    
    # 클러스터 노드 실패 횟수
    stats avg(cluster_failed_node_count) as CountOfNodeFailures 
    | filter Type="Cluster" 
    | sort @timestamp desc
    
    # 파드별 CPU 사용량
    stats pct(container_cpu_usage_total, 50) as CPUPercMedian by kubernetes.container_name 
    | filter Type="Container"
    | sort CPUPercMedian desc


    2.3.4. 메트릭 확인 : CloudWatch → Insights → Container Insights : 우측 상단(Local Time Zone, 30분) ⇒ 리소스 : myeks 선택


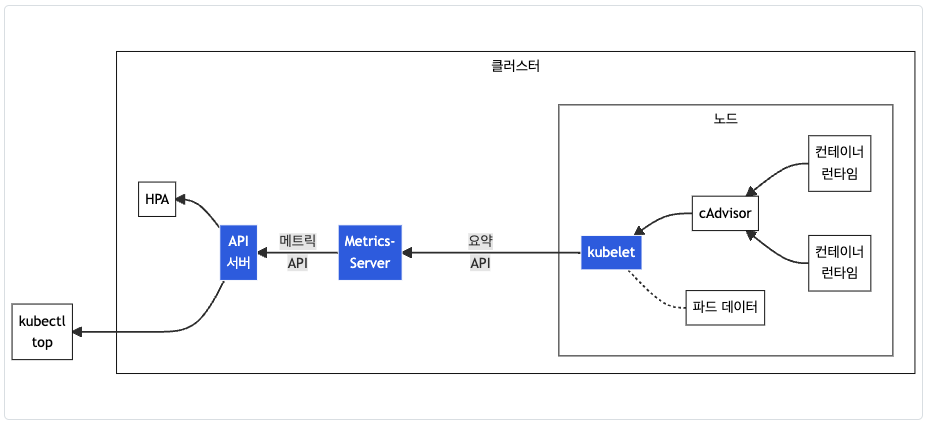
    1. Metrics-server & kwatch & botkube3.1. Metrics-server 확인 : kubelet으로부터 수집한 리소스 메트릭을 수집 및 집계하는 클러스터 애드온 구성 요소 - EKS Github Docs CMD
      • cAdvisor : kubelet에 포함된 컨테이너 메트릭을 수집, 집계, 노출하는 데몬
      # 배포 : eks 1.31 version 이상부터는 addon 으로 배포되어 있어 배포하지 않고 addon로 추가 가능!!
      kubectl apply -f https://github.com/kubernetes-sigs/metrics-server/releases/latest/download/components.yaml
      
      # 메트릭 서버 확인 : 메트릭은 15초 간격으로 cAdvisor를 통하여 가져옴
      kubectl get pod -n kube-system -l app.kubernetes.io/name=metrics-server
      kubectl api-resources | grep metrics
      kubectl get apiservices |egrep '(AVAILABLE|metrics)'
      
      # 노드 메트릭 확인
      kubectl top node
      
      # 파드 메트릭 확인
      kubectl top pod -A
      kubectl top pod -n kube-system --sort-by='cpu'
      kubectl top pod -n kube-system --sort-by='memory'

      # 닉네임
      NICK=<각자 자신의 닉네임>
      NICK=gasida
      
      # configmap 생성
      cat <<EOF | kubectl apply -f -
      apiVersion: v1
      kind: Namespace
      metadata:
        name: kwatch
      ---
      apiVersion: v1
      kind: ConfigMap
      metadata:
        name: kwatch
        namespace: kwatch
      data:
        config.yaml: |
          alert:
            slack:
              webhook: '[SLACK_WEBHOOK_URL]'
              title: $NICK-eks
          pvcMonitor:
            enabled: true
            interval: 5
            threshold: 70
      EOF
      
      # 배포
      kubectl apply -f https://raw.githubusercontent.com/abahmed/kwatch/v0.8.5/deploy/deploy.yaml
      kubectl apply -f https://raw.githubusercontent.com/abahmed/kwatch/v0.10.1/deploy/deploy.yaml
      • 잘못된 이미지 파드 배포 및 확인
      # 터미널1
      watch kubectl get pod
      
      # 잘못된 이미지 정보의 파드 배포
      cat <<EOF | kubectl apply -f -
      apiVersion: v1
      kind: Pod
      metadata:
        name: nginx-19
      spec:
        containers:
        - name: nginx-pod
          image: nginx:1.19.19  # 존재하지 않는 이미지 버전
      EOF
      kubectl get events -w
      
      # 이미지 업데이트 방안2 : set 사용 - iamge 등 일부 리소스 값을 변경 가능!
      kubectl set 
      kubectl set image pod nginx-19 nginx-pod=nginx:1.19
      
      # 삭제
      kubectl delete pod nginx-19
      
      
      # (옵션) 노드1번 강제 재부팅 해보기
      ssh $N1 sudo reboot
      👉🏻
      파드 + PVC 배포 후 PVC의 저장 공간을 70% 이상 채운 후 kwatch PVC 알람 발생하는지 테스트 해보자
      • kwatch 삭제: kubectl delete -f https://raw.githubusercontent.com/abahmed/kwatch/v0.8.5/deploy/deploy.yaml
    2. 3.2. kwatch 소개 및 설치/사용 : kwatch helps you monitor all changes in your Kubernetes(K8s) cluster, detects crashes in your running apps in realtime, and publishes notifications to your channels (Slack, Discord, etc.) instantly - 링크 Helm Blog

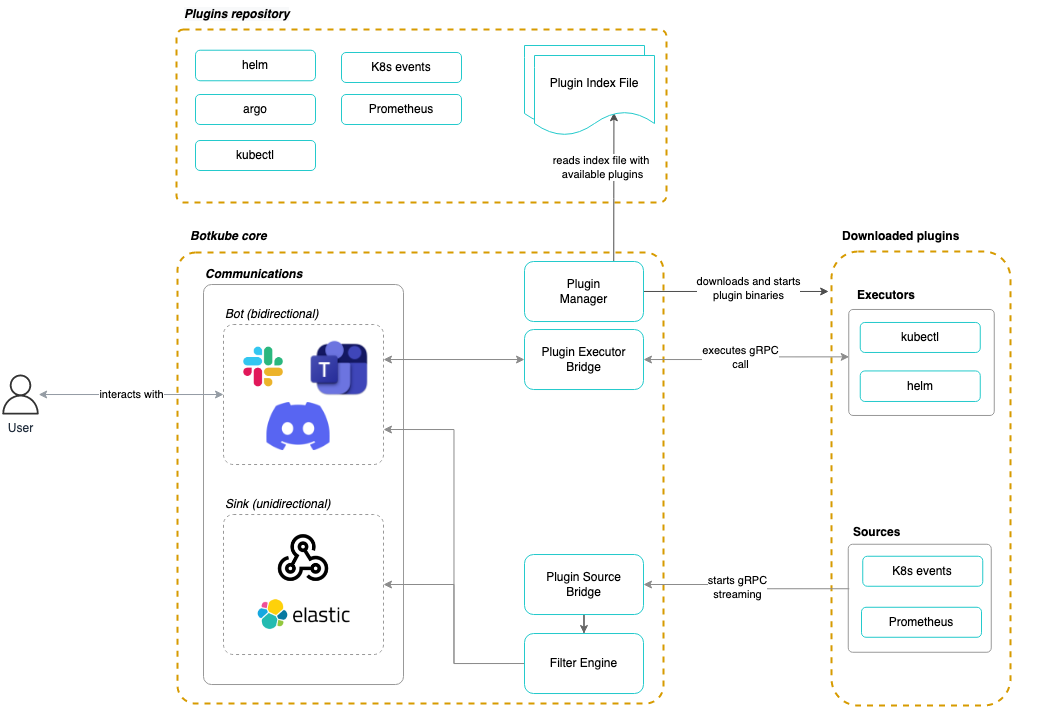
    3.3. Botkube - 공홈 Blog Youtube

    1. 슬랙 앱 설정 : SLACK_API_BOT_TOKEN 과 SLACK_API_APP_TOKEN 생성 - Docs
      export SLACK_API_BOT_TOKEN='xoxb-YYYY'
      export SLACK_API_APP_TOKEN='xapp-YYYXXXXX'
    1. 설치
      # repo 추가
      helm repo add botkube https://charts.botkube.io
      helm repo update
      
      # 변수 지정
      export ALLOW_KUBECTL=true
      export ALLOW_HELM=true
      export SLACK_CHANNEL_NAME=webhook3
      
      #
      cat <<EOT > botkube-values.yaml
      actions:
        'describe-created-resource': # kubectl describe
          enabled: true
        'show-logs-on-error': # kubectl logs
          enabled: true
      
      executors:
        k8s-default-tools:
          botkube/helm:
            enabled: true
          botkube/kubectl:
            enabled: true
      EOT
      
      # 설치
      helm install --version v1.0.0 botkube --namespace botkube --create-namespace \
      --set communications.default-group.socketSlack.enabled=true \
      --set communications.default-group.socketSlack.channels.default.name=${SLACK_CHANNEL_NAME} \
      --set communications.default-group.socketSlack.appToken=${SLACK_API_APP_TOKEN} \
      --set communications.default-group.socketSlack.botToken=${SLACK_API_BOT_TOKEN} \
      --set settings.clusterName=${CLUSTER_NAME} \
      --set 'executors.k8s-default-tools.botkube/kubectl.enabled'=${ALLOW_KUBECTL} \
      --set 'executors.k8s-default-tools.botkube/helm.enabled'=${ALLOW_HELM} \
      -f botkube-values.yaml botkube/botkube
      
      # 참고 : 삭제 시
      helm uninstall botkube --namespace botkube
    1. 사용 - Docs
      # 연결 상태, notifications 상태 확인
      @Botkube ping
      @Botkube status notifications
      
      # 파드 정보 조회
      @Botkube k get pod
      @Botkube kc get pod --namespace kube-system
      @Botkube kubectl get pod --namespace kube-system -o wide
      
      # Actionable notifications
      @Botkube kubectl
    1. 잘못된 이미지 파드 배포 및 확인
      # 터미널1
      watch kubectl get pod
      
      # 잘못된 이미지 정보의 파드 배포
      cat <<EOF | kubectl apply -f -
      apiVersion: v1
      kind: Pod
      metadata:
        name: nginx-19
      spec:
        containers:
        - name: nginx-pod
          image: nginx:1.19.19  # 존재하지 않는 이미지 버전
      EOF
      kubectl get events -w
      @Botkube k get pod
      
      # 이미지 업데이트 방안2 : set 사용 - iamge 등 일부 리소스 값을 변경 가능!
      kubectl set 
      kubectl set image pod nginx-19 nginx-pod=nginx:1.19
      @Botkube k get pod
      
      # 삭제
      kubectl delete pod nginx-19
    1. 삭제: helm uninstall botkube --namespace botkube
    • 참고: ChatGPT 활용 - https://github.com/k8sgpt-ai/k8sgpt, 당신이 누구던 쿠버네티스를 사용한다면 k8sgpt 가 당신을 도와줄 수 있습니다 (손주형)


    1. Prometheus StackPrometheus: The Documentary
      • Prometheus Kubernetes 쌍둥이 음모설 : P8S vs K8S 축약, 둘 다 10글자, 로고 보색 관계(주황 vs 파랑)
      PKOS 2기 4주차 - 쿠버네티스 모니터링(Kubernetes Monitoring) | HanHoRang Tech Blog
      고가용성 모니터링 시스템 구축(프로메테우스, 타노스)
      https://hanhorang31.github.io/post/pkos2-4-monitoring/
    2. (참고) Thanos 타노드 : 프로메테우스 확장성과 고가용성 제공
    3. (참고) 프로메테우스 오퍼레이터 : 프로메테우스 및 프로메테우스 오퍼레이터를 이용하여 메트릭 수집과 알람 기능 실습 ← 최성욱님이 정리해주셨습니다 👍🏻
      pkos 스터디 4주차 - 메트릭 오픈소스 프로메테우스
      4주 차에서는 메트릭 오픈소스인 프로메테우스 오퍼레이터를 공부했습니다. 프로메테우스 오퍼레이터를 이용하여 메트릭 수집방법과 알림기능 실습했습니다. 이번 주차에는 github copilot도움을 받아 프로메테우스 오퍼레이터를 작성했습니다. 사용할 수록 인공지능 성능에 반하고 있습니다.😂 1. 메트릭 시스템 소개 프로메테우스를 공부하기 전에 메트릭 시스템이 무엇인지 아는 것이 좋다고 생각했습니다. 그래서 이 글은 메트릭 시스템 소개로 시작하여 프로메테우스를 설명합니다. 1.1 메트릭 시스템이란? 메트릭 시스템이란 목표대상의 상태값을 수집하고 관리하는 시스템입니다. 상태값은 자원사용률(cpu, memory 등) 또는 애플리케이션 수치(API호출 횟수 등)를 의미합니다. 아래 그림은 메트릭 시스템이 수집한 Ar..
      https://malwareanalysis.tistory.com/566

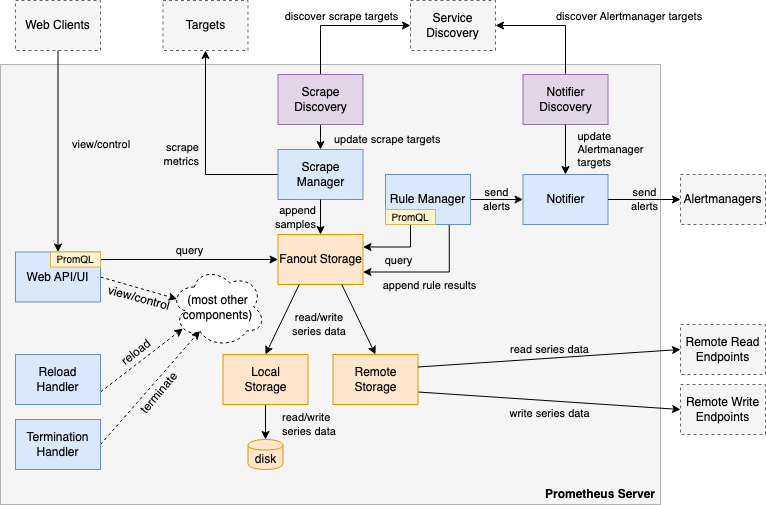
    4.1. Prometheus 소개: Prometheus is an open-source systems monitoring and alerting toolkit originally built at SoundCloud

    제공 기능

    • a multi-dimensional data model with time series data(=TSDB, 시계열 데이터베이스) identified by metric name and key/value pairs
    • no reliance on distributed storage; single server nodes are autonomous - Docs
    • time series collection happens via a pull model over HTTP - Q&A질문 PushPull 수집 방식 장단점?
    • targets are discovered via service discovery or static configuration
    • multiple modes of graphing and dashboarding support

    구성 요소

    • special-purpose exporters for services like HAProxy, StatsD, Graphite, etc.
    • various support tools

    Metrics?

    • 메트릭은 일반인이 이해하기 쉬운 수치적 측정입니다. 시계열이라는 용어는 시간에 따른 변화를 기록하는 것을 말합니다. 사용자가 측정하고자 하는 것은 애플리케이션마다 다릅니다. 웹 서버의 경우 요청 시간이 될 수 있고, 데이터베이스의 경우 활성 연결 또는 활성 쿼리 수가 될 수 있습니다.
      • Metrics are numerical measurements in layperson terms. The term time series refers to the recording of changes over time. What users want to measure differs from application to application. For a web server, it could be request times; for a database, it could be the number of active connections or active queries, and so on.


    4.2.

    [운영서버 EC2] 프로메테우스 싱글 노드 직접 설치 on linux

    - Docs

    • prometheus 설치
      # 최신 버전 다운로드
      wget https://github.com/prometheus/prometheus/releases/download/v3.2.0/prometheus-3.2.0.linux-amd64.tar.gz
      
      # 압축 해제
      tar -xvf prometheus-3.2.0.linux-amd64.tar.gz
      cd prometheus-3.2.0.linux-amd64
      ls -l
      
      #
      mv prometheus /usr/local/bin/
      mv promtool /usr/local/bin/
      mkdir -p /etc/prometheus /var/lib/prometheus
      mv prometheus.yml /etc/prometheus/
      cat /etc/prometheus/prometheus.yml
      
      #
      useradd --no-create-home --shell /sbin/nologin prometheus
      chown -R prometheus:prometheus /etc/prometheus /var/lib/prometheus
      chown prometheus:prometheus /usr/local/bin/prometheus /usr/local/bin/promtool
      
      #
      tee /etc/systemd/system/prometheus.service > /dev/null <<EOF
      [Unit]
      Description=Prometheus
      Wants=network-online.target
      After=network-online.target
      
      [Service]
      User=prometheus
      Group=prometheus
      Type=simple
      ExecStart=/usr/local/bin/prometheus \
        --config.file=/etc/prometheus/prometheus.yml \
        --storage.tsdb.path=/var/lib/prometheus \
        --web.listen-address=0.0.0.0:9090
      
      [Install]
      WantedBy=multi-user.target
      EOF
      
      #
      systemctl daemon-reload
      systemctl enable --now prometheus
      systemctl status prometheus
      ss -tnlp
      
      #
      curl localhost:9090/metrics
      echo -e "http://$(curl -s ipinfo.io/ip):9090"
      
    • node_exporter 설치 - Github
      # Node Exporter 최신 버전 다운로드
      cd ~
      wget https://github.com/prometheus/node_exporter/releases/download/v1.9.0/node_exporter-1.9.0.linux-amd64.tar.gz
      tar xvfz node_exporter-1.9.0.linux-amd64.tar.gz
      cd node_exporter-1.9.0.linux-amd64
      cp node_exporter /usr/local/bin/
      
      #
      groupadd -f node_exporter
      useradd -g node_exporter --no-create-home --shell /sbin/nologin node_exporter
      chown node_exporter:node_exporter /usr/local/bin/node_exporter
      
      #
      tee /etc/systemd/system/node_exporter.service > /dev/null <<EOF
      [Unit]
      Description=Node Exporter
      Documentation=https://prometheus.io/docs/guides/node-exporter/
      Wants=network-online.target
      After=network-online.target
      
      [Service]
      User=node_exporter
      Group=node_exporter
      Type=simple
      Restart=on-failure
      ExecStart=/usr/local/bin/node_exporter \
        --web.listen-address=:9200
      
      [Install]
      WantedBy=multi-user.target
      EOF
      
      # 데몬 실행
      systemctl daemon-reload
      systemctl enable --now node_exporter
      systemctl status node_exporter
      ss -tnlp
      
      #
      curl localhost:9200/metrics
    • prometheus 설정에 수집 대상 target (node_exporter) 추가
      # prometheus.yml 수정
      cat << EOF >> /etc/prometheus/prometheus.yml
      
        - job_name: 'node_exporter'
          static_configs:
            - targets: ["127.0.0.1:9200"]
              labels:
                alias: 'myec2'
      EOF
      
      # prometheus 데몬 재기동
      systemctl restart prometheus.service
      systemctl status prometheus
    • prometheus 웹에서 target 확인 및 node 로 시작되는 메트릭 쿼리 해보기
      rate(node_cpu_seconds_total{mode="system"}[1m])
      node_filesystem_avail_bytes
      rate(node_network_receive_bytes_total[1m])

    4.3. 프로메테우스-스택 설치 : 모니터링에 필요한 여러 요소를 단일 차트(스택)으로 제공 ← 시각화(그라파나), 이벤트 메시지 정책(경고 임계값/수준) 등 - Helm

    • kube-prometheus-stack collects Kubernetes manifests, Grafana dashboards, and Prometheus rules combined with documentation and scripts to provide easy to operate end-to-end Kubernetes cluster monitoring with Prometheus using the Prometheus Operator.
    # 모니터링
    watch kubectl get pod,pvc,svc,ingress -n monitoring
    
    # repo 추가
    helm repo add prometheus-community https://prometheus-community.github.io/helm-charts
    
    # 파라미터 파일 생성
    cat <<EOT > monitor-values.yaml
    prometheus:
      prometheusSpec:
        scrapeInterval: "15s"
        evaluationInterval: "15s"
        podMonitorSelectorNilUsesHelmValues: false
        serviceMonitorSelectorNilUsesHelmValues: false
        retention: 5d
        retentionSize: "10GiB"
        storageSpec:
          volumeClaimTemplate:
            spec:
              storageClassName: gp3
              accessModes: ["ReadWriteOnce"]
              resources:
                requests:
                  storage: 30Gi
    
      ingress:
        enabled: true
        ingressClassName: alb
        hosts: 
          - aews-prometheus.$MyDomain
        paths: 
          - /*
        annotations:
          alb.ingress.kubernetes.io/scheme: internet-facing
          alb.ingress.kubernetes.io/target-type: ip
          alb.ingress.kubernetes.io/listen-ports: '[{"HTTPS":443}, {"HTTP":80}]'
          alb.ingress.kubernetes.io/certificate-arn: $CERT_ARN
          alb.ingress.kubernetes.io/success-codes: 200-399
          alb.ingress.kubernetes.io/load-balancer-name: myeks-ingress-alb
          alb.ingress.kubernetes.io/group.name: study
          alb.ingress.kubernetes.io/ssl-redirect: '443'
    
    grafana:
      defaultDashboardsTimezone: Asia/Seoul
      adminPassword: prom-operator
    
      ingress:
        enabled: true
        ingressClassName: alb
        hosts: 
          - aews-grafana.$MyDomain
        paths: 
          - /*
        annotations:
          alb.ingress.kubernetes.io/scheme: internet-facing
          alb.ingress.kubernetes.io/target-type: ip
          alb.ingress.kubernetes.io/listen-ports: '[{"HTTPS":443}, {"HTTP":80}]'
          alb.ingress.kubernetes.io/certificate-arn: $CERT_ARN
          alb.ingress.kubernetes.io/success-codes: 200-399
          alb.ingress.kubernetes.io/load-balancer-name: myeks-ingress-alb
          alb.ingress.kubernetes.io/group.name: study
          alb.ingress.kubernetes.io/ssl-redirect: '443'
    
      persistence:
        enabled: true
        type: sts
        storageClassName: "gp3"
        accessModes:
          - ReadWriteOnce
        size: 20Gi
    
    alertmanager:
      enabled: false
    defaultRules:
      create: false
    kubeControllerManager:
      enabled: false
    kubeEtcd:
      enabled: false
    kubeScheduler:
      enabled: false
    prometheus-windows-exporter:
      prometheus:
        monitor:
          enabled: false
    EOT
    cat monitor-values.yaml
    
    # 배포
    helm install kube-prometheus-stack prometheus-community/kube-prometheus-stack --version 69.3.1 \
    -f monitor-values.yaml --create-namespace --namespace monitoring
    
    # 확인
    ## alertmanager-0 : 사전에 정의한 정책 기반(예: 노드 다운, 파드 Pending 등)으로 시스템 경고 메시지를 생성 후 경보 채널(슬랙 등)로 전송
    ## grafana-0 : 프로메테우스는 메트릭 정보를 저장하는 용도로 사용하며, 그라파나로 시각화 처리
    ## prometheus-0 : 모니터링 대상이 되는 파드는 ‘exporter’라는 별도의 사이드카 형식의 파드에서 모니터링 메트릭을 노출, pull 방식으로 가져와 내부의 시계열 데이터베이스에 저장
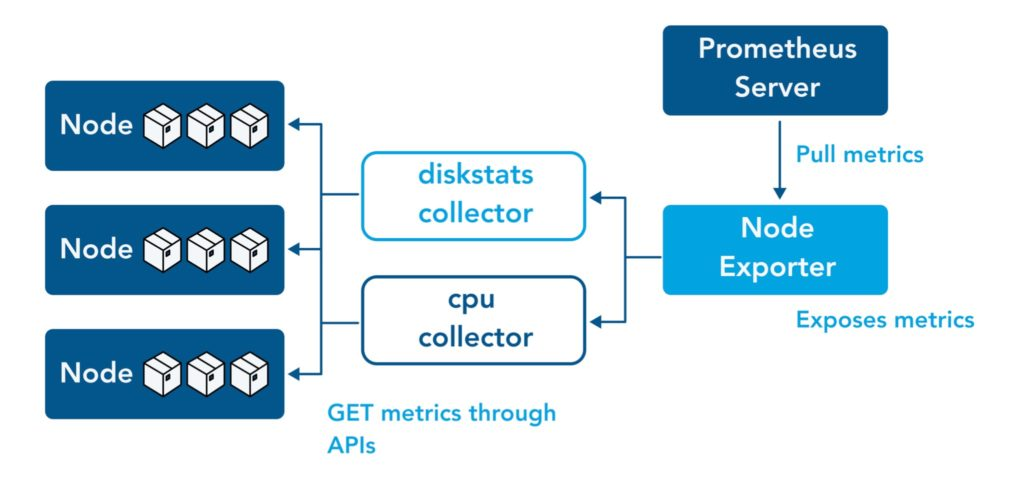
    ## node-exporter : 노드익스포터는 물리 노드에 대한 자원 사용량(네트워크, 스토리지 등 전체) 정보를 메트릭 형태로 변경하여 노출
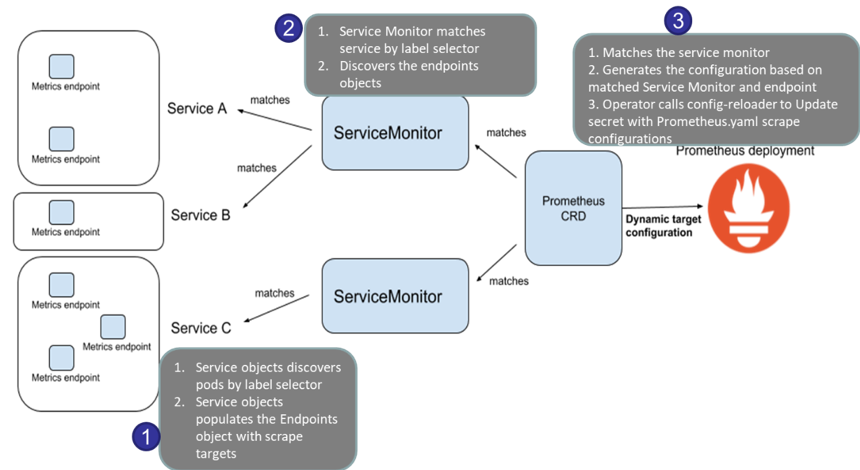
    ## operator : 시스템 경고 메시지 정책(prometheus rule), 애플리케이션 모니터링 대상 추가 등의 작업을 편리하게 할수 있게 CRD 지원
    ## kube-state-metrics : 쿠버네티스의 클러스터의 상태(kube-state)를 메트릭으로 변환하는 파드
    helm list -n monitoring
    kubectl get sts,ds,deploy,pod,svc,ep,ingress,pvc,pv -n monitoring
    kubectl get-all -n monitoring
    kubectl get prometheus,servicemonitors -n monitoring
    kubectl get crd | grep monitoring
    kubectl df-pv
    
    # 프로메테우스 버전 확인
    echo -e "https://prometheus.$MyDomain/api/v1/status/buildinfo"
    open https://prometheus.$MyDomain/api/v1/status/buildinfo # macOS
    kubectl exec -it sts/prometheus-kube-prometheus-stack-prometheus -n monitoring -c prometheus -- prometheus --version
    prometheus, version 3.1.0 (branch: HEAD, revision: 7086161a93b262aa0949dbf2aba15a5a7b13e0a3)
    ...
    
    # 프로메테우스 웹 접속
    echo -e "https://prometheus.$MyDomain"
    open "https://prometheus.$MyDomain" # macOS
    
    # 그라파나 웹 접속
    echo -e "https://grafana.$MyDomain"
    open "https://grafana.$MyDomain" # macOS
    
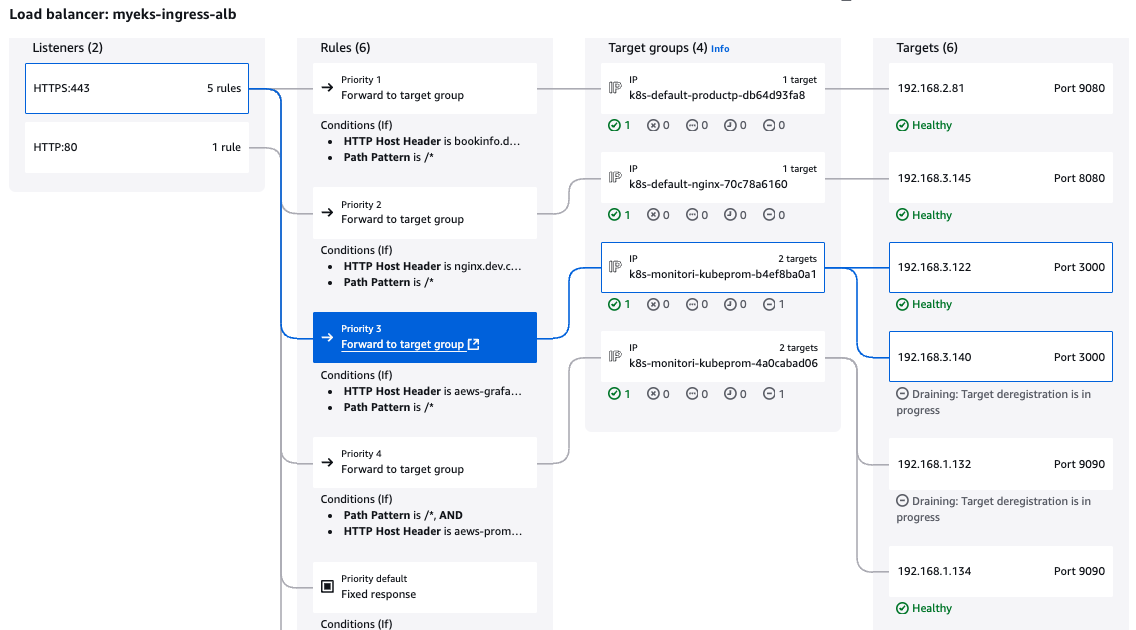
    • AWS ELB(ALB) 갯수 확인 → Rule 확인(어떻게 여러 도메인 처리를 하는 걸까?) ⇒ HTTP(80) 인입 시 어떻게 처리하나요?
    • (참고) kube-controller-manager, etcd, kube-scheduler
      • 수집 불가?
        • EKS는 기본적으로 static pod들 kube-controller-manager, etcd, kube-scheduler등이 모두 AWS Managed 영역에 배포되기 때문에 prometheus를 통해서 기본적으로는 수집 할 수 없지만, Cloudwatch agent를 통해서 Prometheus에서 수집할 수 있는 방법을 제시하고 있다. ⇒ 구글링 , AWS_Docs
      • 프로메테우스 웹 → Status → Targets 확인 : kube-controller-manager, etcd, kube-scheduler 확인
      • AWS EKS Control Plane 의 scheduler 과 controller-manager 메트릭을 오픈소스 프로메테우스에서 수집하게 설정 - AWS_Docs
    • (참고) 삭제 시
      # helm 삭제
      helm uninstall -n monitoring kube-prometheus-stack
      
      # crd 삭제
      kubectl delete crd alertmanagerconfigs.monitoring.coreos.com
      kubectl delete crd alertmanagers.monitoring.coreos.com
      kubectl delete crd podmonitors.monitoring.coreos.com
      kubectl delete crd probes.monitoring.coreos.com
      kubectl delete crd prometheuses.monitoring.coreos.com
      kubectl delete crd prometheusrules.monitoring.coreos.com
      kubectl delete crd servicemonitors.monitoring.coreos.com
      kubectl delete crd thanosrulers.monitoring.coreos.com

    4.4. [Amazon EKS] AWS CNI Metrics 수집을 위한 사전 설정 - 링크

    # PodMonitor 배포
    cat <<EOF | kubectl create -f -
    apiVersion: monitoring.coreos.com/v1
    kind: PodMonitor
    metadata:
      name: aws-cni-metrics
      namespace: kube-system
    spec:
      jobLabel: k8s-app
      namespaceSelector:
        matchNames:
        - kube-system
      podMetricsEndpoints:
      - interval: 30s
        path: /metrics
        port: metrics
      selector:
        matchLabels:
          k8s-app: aws-node
    EOF
    
    # PodMonitor 확인
    kubectl get podmonitor -n kube-system
    kubectl get podmonitor -n kube-system aws-cni-metrics -o yaml | kubectl neat
    
    # aws-node는 ds로 배포되어 각 node에서 "hostPort: 61678"를 export하고 있다.
    [ec2-user@ip-192-168-1-236 ~]$ ss -tnp
    State Recv-Q Send-Q          Local Address:Port            Peer Address:Port Process
    ESTAB 0      0               192.168.1.236:22            121.133.78.246:63535       
    ESTAB 0      0               192.168.1.236:49088             10.100.0.1:443         
    ESTAB 0      0               192.168.1.236:46070           192.168.1.19:443         
    ESTAB 0      0               192.168.1.236:53266          192.168.3.102:443         
    ESTAB 0      0               192.168.1.236:49104             10.100.0.1:443         
    ESTAB 0      0               192.168.1.236:57228          52.95.195.121:443         
    ESTAB 0      0      [::ffff:192.168.1.236]:10250  [::ffff:192.168.1.24]:58978       
    ESTAB 0      0      [::ffff:192.168.1.236]:61678 [::ffff:192.168.1.134]:39344       
    ESTAB 0      0      [::ffff:192.168.1.236]:10249 [::ffff:192.168.1.134]:41298       
    ESTAB 0      0      [::ffff:192.168.1.236]:9100  [::ffff:192.168.1.134]:52198       
    ESTAB 0      0      [::ffff:192.168.1.236]:10250 [::ffff:192.168.1.134]:35692       
    ESTAB 0      0      [::ffff:192.168.1.236]:10250 [::ffff:192.168.1.134]:58524       
    ESTAB 0      0      [::ffff:192.168.1.236]:10250   [::ffff:192.168.3.8]:36462       
    ESTAB 0      0      [::ffff:192.168.1.236]:10250 [::ffff:192.168.1.134]:35690
    
    # metrics url 접속 확인
    curl -s $N1:61678/metrics | grep '^awscni'
    awscni_add_ip_req_count 10
    awscni_assigned_ip_addresses 8
    awscni_assigned_ip_per_cidr{cidr="192.168.1.117/32"} 1
    awscni_assigned_ip_per_cidr{cidr="192.168.1.131/32"} 1
    awscni_assigned_ip_per_cidr{cidr="192.168.1.184/32"} 1
    awscni_assigned_ip_per_cidr{cidr="192.168.1.210/32"} 0
    awscni_assigned_ip_per_cidr{cidr="192.168.1.243/32"} 1
    awscni_assigned_ip_per_cidr{cidr="192.168.1.247/32"} 1
    awscni_assigned_ip_per_cidr{cidr="192.168.1.38/32"} 1
    ...
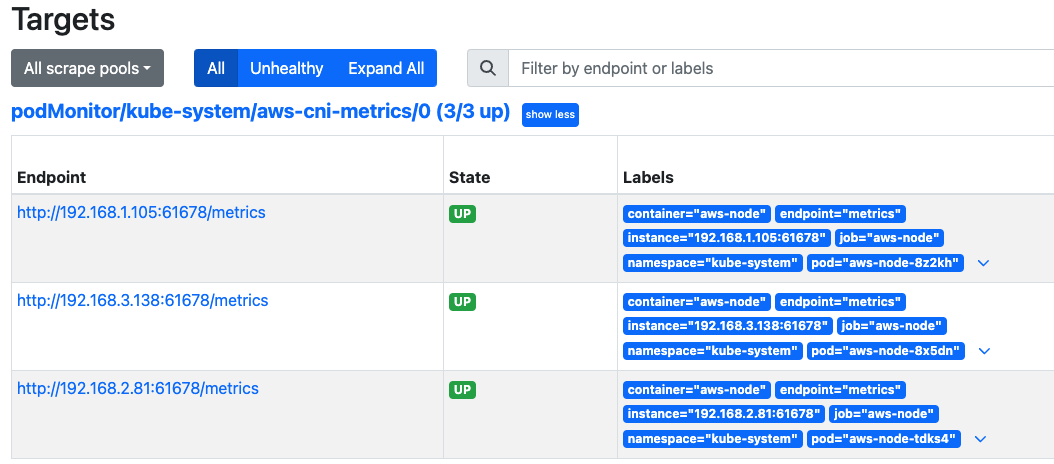
    • 프로메테우스 Target , job (aws-cni 검색)


    4.5. podMonitor vs serviceMonitor

    Feature PodMonitor ServiceMonitor
    모니터링 대상 개별 Pod (서비스와 관계없이 Pod 수준에서 메트릭 수집) Service (서비스가 제공하는 여러 Pod들의 메트릭 수집)
    대상 리소스 Pod Service
    사용 상황 Pod 자체에서 메트릭을 노출할 때 (예: 애플리케이션이 Pod에 직접 메트릭 노출) 서비스 수준에서 메트릭을 노출할 때 (여러 Pod이 하나의 서비스로 묶일 때)
    PodSelector/ServiceSelector podSelector (Pod 선택) selector (Service 선택)
    주요 사용 예 Pod 내에서 메트릭을 제공하는 경우, 서비스 레벨이 아닌 Pod 수준에서 메트릭 수집 여러 Pod가 하나의 서비스로 묶여 있을 때, 서비스 수준에서 메트릭 수집
    • 언제 어떤 리소스를 사용해야 할까?
      • PodMonitor: 개별 Pod에서 메트릭을 제공하고 있을 때, 서비스와 관계없이 Pod 자체에서 메트릭을 수집하려면 PodMonitor를 사용합니다.
        • ex) Pod 자체에서 메트릭을 노출하고 있고, 서비스 레벨이 아닌 각 Pod을 개별적으로 모니터링하려는 경우.
        # example-app 라벨을 가진 Pod에서 metrics라는 포트를 통해 /metrics 경로의 메트릭을 30초 간격으로 수집하도록 Prometheus에 지시합니다.
        apiVersion: monitoring.coreos.com/v1
        kind: PodMonitor
        metadata:
          name: example-podmonitor
        spec:
          selector:
            matchLabels:
              app: example-app
          podMetricsEndpoints:
            - port: metrics
              path: /metrics
              interval: 30s
      • ServiceMonitor: 여러 Pod이 하나의 서비스로 묶여 있고, 해당 서비스가 제공하는 메트릭을 수집하려면 ServiceMonitor를 사용합니다.
        • ex) 여러 개의 Pod가 하나의 서비스를 통해 메트릭을 제공하고 있을 때, 서비스 단위로 메트릭을 수집하려는 경우.
        # example-app 라벨을 가진 서비스를 선택하고, 그 서비스의 metrics 포트에서 /metrics 경로를 30초 간격으로 수집하도록 Prometheus에 지시합니다.
        apiVersion: monitoring.coreos.com/v1
        kind: ServiceMonitor
        metadata:
          name: example-servicemonitor
        spec:
          selector:
            matchLabels:
              app: example-app
          endpoints:
            - port: metrics
              path: /metrics
              interval: 30s
          namespaceSelector:
            matchNames:
              - default
        

    4.6. 프로메테우스 기본 사용 : 모니터링 그래프

    • 모니터링 대상이 되는 서비스는 일반적으로 자체 웹 서버의 /metrics 엔드포인트 경로에 다양한 메트릭 정보를 노출
    • 이후 프로메테우스는 해당 경로에 http get 방식으로 메트릭 정보를 가져와 TSDB 형식으로 저장
    # 아래 처럼 프로메테우스가 각 서비스의 포트 접속하여 메트릭 정보를 수집
    kubectl get node -owide
    kubectl get svc,ep -n monitoring kube-prometheus-stack-prometheus-node-exporter
    
    # (노드 익스포터 경우) 노드의 9100번 포트의 /metrics 접속 시 다양한 메트릭 정보를 확인할수 있음 : 마스터 이외에 워커노드도 확인 가능
    ssh ec2-user@$N1 curl -s localhost:9100/metrics
    • 프로메테우스 ingress 도메인으로 웹 접속
    # ingress 확인
    kubectl get ingress -n monitoring kube-prometheus-stack-prometheus
    kubectl describe ingress -n monitoring kube-prometheus-stack-prometheus
    
    # 프로메테우스 ingress 도메인으로 웹 접속
    echo -e "Prometheus Web URL = https://prometheus.$MyDomain"
    open "https://prometheus.$MyDomain" macOS
    
    # 웹 상단 주요 메뉴 설명
    1. 쿼리(Query) : 프로메테우스 자체 검색 언어 PromQL을 이용하여 메트릭 정보를 조회 -> 단순한 그래프 형태 조회
    2. 경고(Alerts) : 사전에 정의한 시스템 경고 정책(Prometheus Rules)에 대한 상황
    3. 상태(Status) : 경고 메시지 정책(Rules), 모니터링 대상(Targets) 등 다양한 프로메테우스 설정 내역을 확인 > 버전 정ㅗ
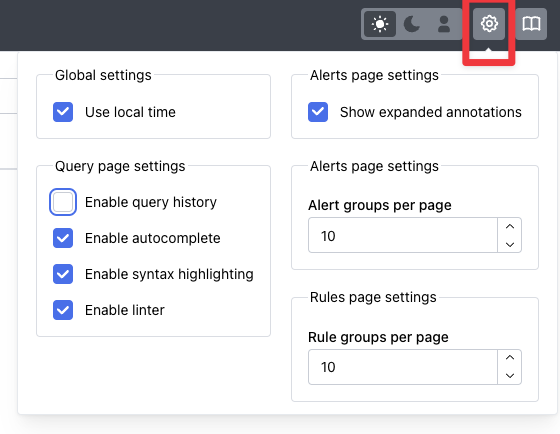
    • 쿼리 입력 옵션
      • Use local time : 출력 시간을 로컬 타임으로 변경
      • Enable query history : PromQL 쿼리 히스토리 활성화
      • Enable autocomplete : 자동 완성 기능 활성화
      • Enable highlighting : 하이라이팅 기능 활성화
      • Enable linter : 문법 오류 감지, 자동 코스 스타일 체크
    • Statues → 프로메테우스 설정(Configuration) 확인 : Status → Runtime & Build Information 클릭
      • Storage retention : 5d or 10GiB → 메트릭 저장 기간이 5일 경과 혹은 10GiB 이상 시 오래된 것부터 삭제 ⇒ helm 파라미터에서 수정 가능
    • Statues → 프로메테우스 설정(Configuration) 확인 : Status → Command-Line Flags 클릭
      • -log.level : info
      • -storage.tsdb.retention.size : 10GiB
      • -storage.tsdb.retention.time : 5d
    • Statues → 프로메테우스 설정(Configuration) 확인 : Status → Configuration
      • job name 을 기준으로 scraping
        global:
          scrape_interval: 15s     # 메트릭 가져오는(scrape) 주기
          scrape_timeout: 10s      # 메트릭 가져오는(scrape) 타임아웃
          evaluation_interval: 15s # alert 보낼지 말지 판단하는 주기
        ...
        - job_name: serviceMonitor/monitoring/kube-prometheus-stack-prometheus-node-exporter/0
          scrape_interval: 30s
          scrape_timeout: 10s
          metrics_path: /metrics
          scheme: http
          ...
          relabel_configs:
          - source_labels: [job]
            separator: ;
            target_label: __tmp_prometheus_job_name
            replacement: $1
            action: replace
          - source_labels: [__meta_kubernetes_service_label_app_kubernetes_io_instance, __meta_kubernetes_service_labelpresent_app_kubernetes_io_instance]
            separator: ;
            regex: (kube-prometheus-stack);true
            replacement: $1
            action: keep
          - source_labels: [__meta_kubernetes_service_label_app_kubernetes_io_name, __meta_kubernetes_service_labelpresent_app_kubernetes_io_name]
            separator: ;
            regex: (prometheus-node-exporter);true
            replacement: $1
            action: keep
          ...
        kubernetes_sd_configs:    # 서비스 디스커버리(SD) 방식을 이용하고, 파드의 엔드포인트 List 자동 반영
          - role: endpoints       # 서비스에 연결된 엔드포인트(Pod IP + Port) 탐색
            kubeconfig_file: ""   # Prometheus가 실행 중인 환경의 기본 kubeconfig 사용
            follow_redirects: true # 엔드포인트를 변경할 경우 이를 따라감
            enable_http2: true
            namespaces:
              own_namespace: false # 자신이 실행 중인 네임스페이스가 아닌 곳에서도 탐색 가능
              names:
              - monitoring        # 서비스 엔드포인트가 속한 네임 스페이스 이름을 지정 : monitoring 네임스페이스에 있는 서비스만 타겟팅, 서비스 네임스페이스가 속한 포트 번호를 구분하여 메트릭 정보를 가져옴
        ...
        
        
        - job_name: podMonitor/kube-system/aws-cni-metrics/0
          honor_timestamps: true
          ...
          relabel_configs:
          - source_labels: [job] 
            separator: ;
            target_label: __tmp_prometheus_job_name
            replacement: $1
            action: replace # job 라벨 값을 __tmp_prometheus_job_name에 저장
          - source_labels: [__meta_kubernetes_pod_label_k8s_app, __meta_kubernetes_pod_labelpresent_k8s_app]
            separator: ;
            regex: (aws-node);true
            replacement: $1
            action: keep    # Pod의 k8s_app 라벨 값이 aws-node인 경우만 유지
          ...
        kubernetes_sd_configs:
        - role: pod               # 클러스터 내 모든 개별 Pod 탐색
          kubeconfig_file: ""
          follow_redirects: true
          enable_http2: true
          namespaces:
            own_namespace: false
            names:
            - kube-system
        ...
    • 전체 메트릭 대상(Targets) 확인 : StatusTarget health
      • 해당 스택은 ‘노드-익스포터’, cAdvisor, 쿠버네티스 전반적인 현황 이외에 다양한 메트릭을 포함
      • 현재 각 Target 클릭 시 메트릭 정보 확인 : 아래 예시
        # serviceMonitor/monitoring/kube-prometheus-stack-kube-proxy/0 (3/3 up) 중 노드1에 Endpoint 접속 확인 (접속 주소는 실습 환경에 따라 다름)
        ssh $N1 curl -s http://localhost:10249/metrics
        rest_client_response_size_bytes_bucket{host="d32fe5b7a60fa23a8cc7778161589520.gr7.ap-northeast-2.eks.amazonaws.com",verb="POST",le="1.048576e+06"} 1
        rest_client_response_size_bytes_bucket{host="d32fe5b7a60fa23a8cc7778161589520.gr7.ap-northeast-2.eks.amazonaws.com",verb="POST",le="4.194304e+06"} 1
        rest_client_response_size_bytes_bucket{host="d32fe5b7a60fa23a8cc7778161589520.gr7.ap-northeast-2.eks.amazonaws.com",verb="POST",le="1.6777216e+07"} 1
        rest_client_response_size_bytes_bucket{host="d32fe5b7a60fa23a8cc7778161589520.gr7.ap-northeast-2.eks.amazonaws.com",verb="POST",le="+Inf"} 1
        rest_client_response_size_bytes_sum{host="d32fe5b7a60fa23a8cc7778161589520.gr7.ap-northeast-2.eks.amazonaws.com",verb="POST"} 626
        rest_client_response_size_bytes_count{host="d32fe5b7a60fa23a8cc7778161589520.gr7.ap-northeast-2.eks.amazonaws.com",verb="POST"} 1
        ...
        
        # [운영서버 EC2] serviceMonitor/monitoring/kube-prometheus-stack-api-server/0 (2/2 up) 중 Endpoint 접속 확인 (접속 주소는 실습 환경에 따라 다름) 
        # >> 해당 IP주소는 어디인가요?, 왜 apiserver endpoint는 2개뿐인가요? , 아래 메트릭 수집이 되게 하기 위해서는 어떻게 하면 될까요?
        # -> 위의 주소는 EKS Cluster가 배포된 vpc에 있는 EKS Owned IP로 data plane의 kube-proxy와 kubelet이 control plane의 apiserver와 private 통신하기 위한 ip이다.
        # -> 기본적으로 운영서버에는 curl이 막혀있으므로, 아래와 같이 curl로 확인하려면 해당 ENI를 찾아 운영서버의 ip를 inbound open해줘야 됨
        curl -s https://192.168.3.102/metrics | tail -n 5
        ...
        
        # [운영서버 EC2] 그외 다른 타켓의 Endpoint 로 접속 확인 가능 : 예시) 아래는 coredns 의 Endpoint 주소 (접속 주소는 실습 환경에 따라 다름)
        curl -s http://192.168.1.150:9153/metrics | tail -n 5
        # TYPE process_virtual_memory_bytes gauge
        process_virtual_memory_bytes 7.79350016e+08
        # HELP process_virtual_memory_max_bytes Maximum amount of virtual memory available in bytes.
        # TYPE process_virtual_memory_max_bytes gauge
        process_virtual_memory_max_bytes 1.8446744073709552e+19
    • 프로메테우스 설정(Configuration) 확인 : Status → Service Discovery : 모든 endpoint 로 도달 가능 시 자동 발견!, 도달 규칙은 설정Configuration 파일에 정의
      • 예) serviceMonitor/monitoring/kube-prometheus-stack-apiserver/0 경우 해당 __address__="192.168.1.19:443" 도달 가능 시 자동 발견됨


    • 메트릭을 그래프(Graph)로 조회 : Graph - 아래 PromQL 쿼리(전체 클러스터 노드의 CPU 사용량 합계)입력 후 조회 → Graph 확인
      • 혹은 지구 아이콘(Metrics Explorer) 클릭 시 전체 메트릭 출력되며, 해당 메트릭 클릭해서 확인
      node_cpu_seconds_total
      node_cpu_seconds_total{mode="idle"}
      (node_cpu_seconds_total{mode="idle"}[1m])
      # 노드 메트릭
      node 입력 후 자동 출력되는 메트릭 확인 후 선택
      node_boot_time_seconds
      
      # kube 메트릭
      kube 입력 후 자동 출력되는 메트릭 확인 후 선택

    4.7. [중급] 쿼리 : node-exporter , kube-state-metrics , kube-proxy

    • node-exporter : /proc, /sys 정보 - Link Docs
      # Table 아래 쿼리 입력 후 Execute 클릭 -> Graph 확인
      ## 출력되는 메트릭 정보는 node-exporter 를 통해서 노드에서 수집된 정보
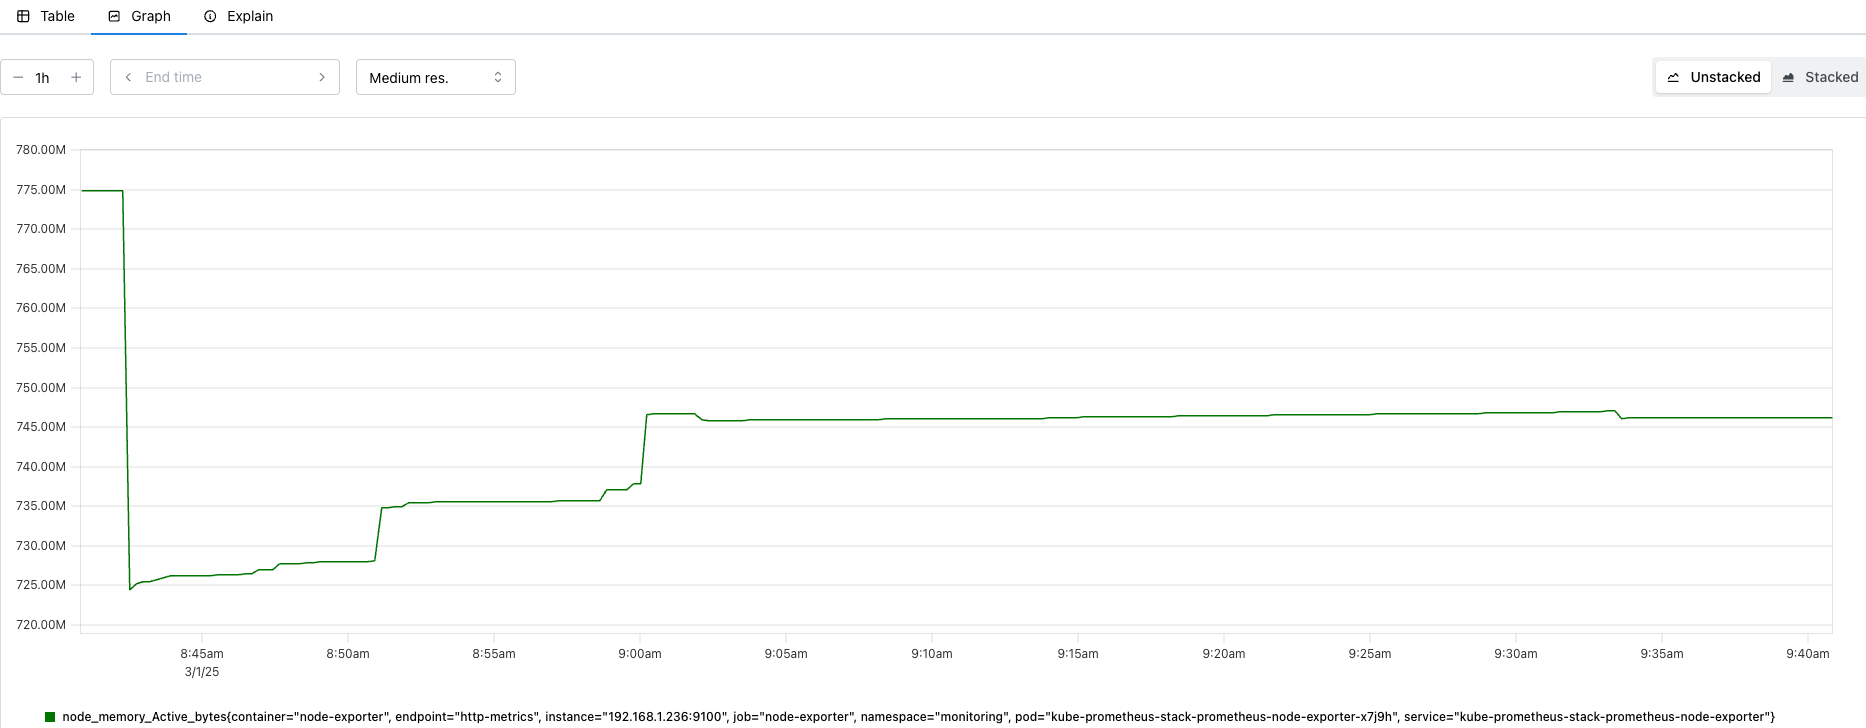
      node_memory_Active_bytes
      
      # 특정 노드(인스턴스) 필터링 : 아래 IP는 출력되는 자신의 인스턴스 PrivateIP 입력 후 Execute 클릭 -> Graph 확인
      node_memory_Active_bytes{instance="192.168.1.236:9100"}
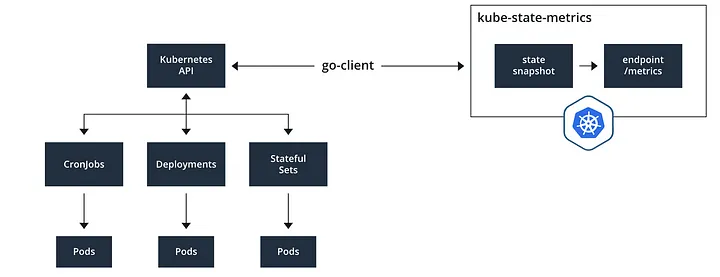
    • kube-state-metrics (ksm) : k8s api 통해 k8s 오브젝트 정보 수집 - Link
      # replicas's number
      kube_deployment_status_replicas
      kube_deployment_status_replicas_available
      kube_deployment_status_replicas_available{deployment="coredns"}
      
      # scale out
      kubectl scale deployment -n kube-system coredns --replicas 3
      
      # 확인
      kube_deployment_status_replicas_available{deployment="coredns"}
      
      # scale in
      kubectl scale deployment -n kube-system coredns --replicas 1
    • kube-proxy : Github → 이미 애플리케이션 내장으로 메트릭 노출 준비 설정됨! (아래 코드 설명 by ChatGPT)
      • Kubernetes의 kube-proxy에서 사용되는 성능 및 상태 모니터링을 위한 메트릭을 정의하는 코드이다.
      • iptables, IPVS, NFTables 등 프록시 모드별로 적절한 메트릭을 등록 및 관리한다.
      • Netfilter 기반의 패킷 통계(nfacct)도 지원하여 패킷 드롭 및 로컬 트래픽 모니터링 기능을 포함한다.
      kubectl get svc -n kube-system kube-prometheus-stack-kube-proxy 
      NAME                               TYPE        CLUSTER-IP   EXTERNAL-IP   PORT(S)     AGE
      kube-prometheus-stack-kube-proxy   ClusterIP   None         <none>        10249/TCP   4h43m
      
      # N1
      [root@ip-192-168-1-236 ~]# lsof -i :10249
      COMMAND    PID USER   FD   TYPE DEVICE SIZE/OFF NODE NAME
      kube-prox 2690 root   11u  IPv6 231889      0t0  TCP ip-192-168-1-236.ap-northeast-2.compute.internal:10249->ip-192-168-1-134.ap-northeast-2.compute.internal:41298 (ESTABLISHED)
      kube-prox 2690 root   22u  IPv6  20136      0t0  TCP *:10249 (LISTEN)
      
      # 운영서버
      curl http://192.168.1.236:10249/metrics
      ...
      rest_client_response_size_bytes_bucket{host="d32fe5b7a60fa23a8cc7778161589520.gr7.ap-northeast-2.eks.amazonaws.com",verb="POST",le="1.048576e+06"} 1
      rest_client_response_size_bytes_bucket{host="d32fe5b7a60fa23a8cc7778161589520.gr7.ap-northeast-2.eks.amazonaws.com",verb="POST",le="4.194304e+06"} 1
      rest_client_response_size_bytes_bucket{host="d32fe5b7a60fa23a8cc7778161589520.gr7.ap-northeast-2.eks.amazonaws.com",verb="POST",le="1.6777216e+07"} 1
      rest_client_response_size_bytes_bucket{host="d32fe5b7a60fa23a8cc7778161589520.gr7.ap-northeast-2.eks.amazonaws.com",verb="POST",le="+Inf"} 1
      rest_client_response_size_bytes_sum{host="d32fe5b7a60fa23a8cc7778161589520.gr7.ap-northeast-2.eks.amazonaws.com",verb="POST"} 626
      rest_client_response_size_bytes_count{host="d32fe5b7a60fa23a8cc7778161589520.gr7.ap-northeast-2.eks.amazonaws.com",verb="POST"} 1
      ...
      #
      kubeproxy_sync_proxy_rules_iptables_total
      kubeproxy_sync_proxy_rules_iptables_total{table="filter"}
      kubeproxy_sync_proxy_rules_iptables_total{table="nat"}
      kubeproxy_sync_proxy_rules_iptables_total{table="nat", instance="192.168.1.188:10249"}
    • coredns 역시 미리 metrics 노출 준비가 설정되어있음 - https://coredns.io/plugins/metrics/
      spec:
        containers:
      		ports:
      		    - containerPort: 53
      		      name: dns
      		      protocol: UDP
      		    - containerPort: 53
      		      name: dns-tcp
      		      protocol: TCP
      		    - containerPort: 9153
      		      name: metrics
      		      protocol: TCP

    4.7. ServiceMonitor 동작 방식 확인 - NGINX 웹서버 애플리케이션 모니터링 설정 및 접속

    • 서비스모니터 동작
    • nginx 를 helm 설치 시 프로메테우스 익스포터 Exporter 옵션 설정 시 자동으로 nginx 를 프로메테우스 모니터링에 등록 가능!
      • 프로메테우스 설정에서 nginx 모니터링 관련 내용을 서비스 모니터 CRD로 추가 가능!
    • 기존 애플리케이션 파드에 프로메테우스 모니터링을 추가하려면 사이드카 방식을 사용하며 exporter 컨테이너를 추가! - KrBlog
    • nginx 웹 서버(with helm)에 metrics 수집 설정 추가 - Helm
      # 모니터링
      watch -d "kubectl get pod; echo; kubectl get servicemonitors -n monitoring"
      
      # nginx 파드내에 컨테이너 갯수 확인 
      kubectl describe pod -l app.kubernetes.io/instance=nginx
      
      # 파라미터 파일 생성 : 서비스 모니터 방식으로 nginx 모니터링 대상을 등록하고, export 는 9113 포트 사용
      # The chart can deploy ServiceMonitor objects for integration with Prometheus Operator installations. To do so, set the value metrics.serviceMonitor.enabled=true. 
      cat <<EOT > nginx-values.yaml
      metrics:
        enabled: true
      
        service:
          port: 9113
      
        serviceMonitor:
          enabled: true
          namespace: monitoring
          interval: 10s
      EOT
      
      # 배포
      helm upgrade nginx bitnami/nginx --reuse-values -f nginx-values.yaml
      
      # 확인
      kubectl get pod,svc,ep
      kubectl get servicemonitor -n monitoring nginx
      kubectl get servicemonitor -n monitoring nginx -o json | jq
      kubectl get servicemonitor -n monitoring nginx -o yaml | kubectl neat
      
      apiVersion: monitoring.coreos.com/v1
      kind: ServiceMonitor
      metadata:
        annotations:
          meta.helm.sh/release-name: nginx
          meta.helm.sh/release-namespace: default
        labels:
          app.kubernetes.io/instance: nginx
          app.kubernetes.io/managed-by: Helm
          app.kubernetes.io/name: nginx
          app.kubernetes.io/version: 1.27.4
          helm.sh/chart: nginx-19.0.0
        name: nginx
        namespace: monitoring
      spec:
        endpoints:
        - interval: 10s
          path: /metrics
          port: metrics
        jobLabel: ""
        namespaceSelector:
          matchNames:
          - default
        selector:
          matchLabels:
            app.kubernetes.io/instance: nginx
            app.kubernetes.io/name: nginx
      
      # prometheus의 serviceMonitor, podMonitor 설정값들이 secret으로 prometheus-kube-prometheus-stack-prometheus에 설정된다.
      # 아래서 설명하겠지만, prometheus server의 config-reloader에 의해 새롭게 추가된 config가 설정된후 reload되면서 적용된다.
      kubectl krew install view-secret
      kubectl get secret  -n monitoring
      kubectl view-secret -n monitoring prometheus-kube-prometheus-stack-prometheus
      kubectl view-secret -n monitoring prometheus-kube-prometheus-stack-prometheus | zcat | more
      kubectl view-secret -n monitoring prometheus-kube-prometheus-stack-prometheus | zcat | grep nginx -A 20
      
      # [운영서버 EC2] 메트릭 확인 >> 프로메테우스에서 Target 확인
      ## nginx sub_status url 접속해보기
      NGINXIP=$(kubectl get pod -l app.kubernetes.io/instance=nginx -o jsonpath="{.items[0].status.podIP}")
      curl -s http://$NGINXIP:9113/metrics # nginx_connections_active Y 값 확인해보기
      curl -s http://$NGINXIP:9113/metrics | grep ^nginx_connections_active
      
      # nginx 파드내에 컨테이너 갯수 확인 : metrics 컨테이너 확인
      kubectl get pod -l app.kubernetes.io/instance=nginx
      kubectl describe pod -l app.kubernetes.io/instance=nginx
      
      # 접속 주소 확인 및 접속
      echo -e "Nginx WebServer URL = https://nginx.$MyDomain"
      curl -s https://nginx.$MyDomain
      kubectl stern deploy/nginx
      
      # 반복 접속
      while true; do curl -s https://nginx.$MyDomain -I | head -n 1; date; sleep 1; done
    • 서비스 모니터링 생성 후 3분 정도 후에 프로메테우스 웹서버에서 State → Targets 에 nginx 서비스 모니터 추가 확인
    • State → Configuration : nginx 검색 후 job 확인
      • (참고) job_name : serviceMonitor/monitoring/nginx/0
        - job_name: serviceMonitor/monitoring/nginx/0
          honor_timestamps: true
          track_timestamps_staleness: false
          scrape_interval: 10s
          scrape_timeout: 10s
          scrape_protocols:
          - OpenMetricsText1.0.0
          - OpenMetricsText0.0.1
          - PrometheusText1.0.0
          - PrometheusText0.0.4
          metrics_path: /metrics
          scheme: http
          enable_compression: true
          follow_redirects: true
          enable_http2: true
          relabel_configs:
          - source_labels: [job]
            separator: ;
            target_label: __tmp_prometheus_job_name
            replacement: $1
            action: replace
          - source_labels: [__meta_kubernetes_service_label_app_kubernetes_io_instance, __meta_kubernetes_service_labelpresent_app_kubernetes_io_instance]
            separator: ;
            regex: (nginx);true
            replacement: $1
            action: keep
          - source_labels: [__meta_kubernetes_service_label_app_kubernetes_io_name, __meta_kubernetes_service_labelpresent_app_kubernetes_io_name]
            separator: ;
            regex: (nginx);true
            replacement: $1
            action: keep
          - source_labels: [__meta_kubernetes_endpoint_port_name]
            separator: ;
            regex: metrics
            replacement: $1
            action: keep
          - source_labels: [__meta_kubernetes_endpoint_address_target_kind, __meta_kubernetes_endpoint_address_target_name]
            separator: ;
            regex: Node;(.*)
            target_label: node
            replacement: ${1}
            action: replace
          - source_labels: [__meta_kubernetes_endpoint_address_target_kind, __meta_kubernetes_endpoint_address_target_name]
            separator: ;
            regex: Pod;(.*)
            target_label: pod
            replacement: ${1}
            action: replace
          - source_labels: [__meta_kubernetes_namespace]
            separator: ;
            target_label: namespace
            replacement: $1
            action: replace
          - source_labels: [__meta_kubernetes_service_name]
            separator: ;
            target_label: service
            replacement: $1
            action: replace
          - source_labels: [__meta_kubernetes_pod_name]
            separator: ;
            target_label: pod
            replacement: $1
            action: replace
          - source_labels: [__meta_kubernetes_pod_container_name]
            separator: ;
            target_label: container
            replacement: $1
            action: replace
          - source_labels: [__meta_kubernetes_pod_phase]
            separator: ;
            regex: (Failed|Succeeded)
            replacement: $1
            action: drop
          - source_labels: [__meta_kubernetes_service_name]
            separator: ;
            target_label: job
            replacement: ${1}
            action: replace
          - separator: ;
            target_label: endpoint
            replacement: metrics
            action: replace
          - source_labels: [__address__, __tmp_hash]
            separator: ;
            regex: (.+);
            target_label: __tmp_hash
            replacement: $1
            action: replace
          - source_labels: [__tmp_hash]
            separator: ;
            modulus: 1
            target_label: __tmp_hash
            replacement: $1
            action: hashmod
          - source_labels: [__tmp_hash]
            separator: ;
            regex: "0"
            replacement: $1
            action: keep
          kubernetes_sd_configs:
          - role: endpoints
            kubeconfig_file: ""
            follow_redirects: true
            enable_http2: true
            namespaces:
              own_namespace: false
              names:
              - default
      • 설정이 자동으로 반영되는 원리 : 주요 config 적용 필요 시 reloader 동작!
      #
      kubectl describe pod -n monitoring prometheus-kube-prometheus-stack-prometheus-0
      ...
        config-reloader:
          Container ID:  containerd://55ef5f8170f20afd38c01f136d3e5674115b8593ce4c0c30c2f7557e702ee852
          Image:         quay.io/prometheus-operator/prometheus-config-reloader:v0.72.0
          Image ID:      quay.io/prometheus-operator/prometheus-config-reloader@sha256:89a6c7d3fd614ee1ed556f515f5ecf2dba50eec9af418ac8cd129d5fcd2f5c18
          Port:          8080/TCP
          Host Port:     0/TCP
          Command:
            /bin/prometheus-config-reloader
          Args:
            --listen-address=:8080
            --reload-url=http://127.0.0.1:9090/-/reload
            --config-file=/etc/prometheus/config/prometheus.yaml.gz
            --config-envsubst-file=/etc/prometheus/config_out/prometheus.env.yaml
            --watched-dir=/etc/prometheus/rules/prometheus-kube-prometheus-stack-prometheus-rulefiles-0
      ...
    • 쿼리 : 애플리케이션, Graph → nginx_ 입력 시 다양한 메트릭 추가 확인 : nginx_connections_active 등
      # nginx scale out : Targets 확인
      kubectl scale deployment nginx --replicas 2
      
      # 쿼리 Table -> Graph
      nginx_up
      sum(nginx_up)
      
      nginx_http_requests_total
      nginx_connections_active

    4.8. [중급] PromQL - Docs , Blog

    • 프로메테우스 메트릭 종류 (4종) : Counter, Gauge, Histogram, Summary - Link Blog
      • 게이지 Gauge : 특정 시점의 값을 표현하기 위해서 사용하는 메트릭 타입, CPU 온도나 메모리 사용량에 대한 현재 시점 값
      • 카운터 Counter : 누적된 값을 표현하기 위해 사용하는 메트릭 타입, 증가 시 구간 별로 변화(추세) 확인, 계속 증가 → 함수 등으로 활용
      • 서머리 Summary : 구간 내에 있는 메트릭 값의 빈도, 중앙값 등 통계적 메트릭
      • 히스토그램 Histogram : 사전에 미리 정의한 구간 내에 있는 메트릭 값의 빈도를 측정 → 함수로 측정 포맷을 변경
    • PromQL Query - Docs Operator Example
      • Label Matchers : = , ! = , =~ 정규표현식
      # 예시
      node_memory_Active_bytes
      node_memory_Active_bytes{instance="192.168.1.236:9100"}
      node_memory_Active_bytes{instance!="192.168.1.236:9100"}
      
      # 정규표현식
      node_memory_Active_bytes{instance=~"192.168.+"}
      node_memory_Active_bytes{instance=~"192.168.1.+"}
      
      # 다수 대상
      node_memory_Active_bytes{instance=~"192.168.1.236:9100|192.168.2.20:9100"}
      node_memory_Active_bytes{instance!~"192.168.1.236:9100|192.168.2.20:9100"}
      
      # 여러 조건 AND
      kube_deployment_status_replicas_available{namespace="kube-system"}
      kube_deployment_status_replicas_available{namespace="kube-system", deployment="coredns"}
      • Binary Operators 이진 연산자 - Link
        • 산술 이진 연산자 : + - * / * ^
        • 비교 이진 연산자 : = = ! = > < > = < =
        • 논리/집합 이진 연산자 : and 교집합 , or 합집합 , unless 차집합
      # 산술 이진 연산자 : + - * / * ^
      node_memory_Active_bytes
      node_memory_Active_bytes/1024
      node_memory_Active_bytes/1024/1024
      
      # 비교 이진 연산자 : = =  ! = > < > = < =
      nginx_http_requests_total
      nginx_http_requests_total > 100
      nginx_http_requests_total > 10000
      
      # 논리/집합 이진 연산자 : and 교집합 , or 합집합 , unless 차집합
      kube_pod_status_ready
      kube_pod_container_resource_requests
      
      kube_pod_status_ready == 1
      kube_pod_container_resource_requests > 1
      
      kube_pod_status_ready == 1 or kube_pod_container_resource_requests > 1
      kube_pod_status_ready == 1 and kube_pod_container_resource_requests > 1
      • Aggregation Operators 집계 연산자 - Link
        • sum (calculate sum over dimensions) : 조회된 값들을 모두 더함
        • min (select minimum over dimensions) : 조회된 값에서 가장 작은 값을 선택
        • max (select maximum over dimensions) : 조회된 값에서 가장 큰 값을 선택
        • avg (calculate the average over dimensions) : 조회된 값들의 평균 값을 계산
        • group (all values in the resulting vector are 1) : 조회된 값을 모두 ‘1’로 바꿔서 출력
        • stddev (calculate population standard deviation over dimensions) : 조회된 값들의 모 표준 편차를 계산
        • stdvar (calculate population standard variance over dimensions) : 조회된 값들의 모 표준 분산을 계산
        • count (count number of elements in the vector) : 조회된 값들의 갯수를 출력 / 인스턴스 벡터에서만 사용 가능
        • count_values (count number of elements with the same value) : 같은 값을 가지는 요소의 갯수를 출력
        • bottomk (smallest k elements by sample value) : 조회된 값들 중에 가장 작은 값들 k 개 출력
        • topk (largest k elements by sample value) : 조회된 값들 중에 가장 큰 값들 k 개 출력
        • quantile (calculate φ-quantile (0 ≤ φ ≤ 1) over dimensions) : 조회된 값들을 사분위로 나눠서 (0 < $ < 1)로 구성하고, $에 해당 하는 요소들을 출력
      #
      node_memory_Active_bytes
      
      # 출력 값 중 Top 3
      topk(3, node_memory_Active_bytes)
      
      # 출력 값 중 하위 3
      bottomk(3, node_memory_Active_bytes)
      bottomk(3, node_memory_Active_bytes>0)
      
      # node 그룹별: by
      node_cpu_seconds_total
      node_cpu_seconds_total{mode="user"}
      node_cpu_seconds_total{mode="system"}
      
      avg(node_cpu_seconds_total)
      avg(node_cpu_seconds_total) by (instance)
      avg(node_cpu_seconds_total{mode="user"}) by (instance)
      avg(node_cpu_seconds_total{mode="system"}) by (instance)
      
      #
      nginx_http_requests_total
      sum(nginx_http_requests_total)
      sum(nginx_http_requests_total) by (instance)
      
      # 특정 내용 제외하고 출력 : without
      nginx_http_requests_total
      sum(nginx_http_requests_total) without (instance)
      sum(nginx_http_requests_total) without (instance,container,endpoint,job,namespace)
      • Time series selectors : Instant/Range vector selectors, Time Durations, Offset modifier, @ modifier - Link
        • 인스턴스 벡터 Instant Vector : 시점에 대한 메트릭 값만을 가지는 데이터 타입
        • 레인지 벡터 Range Vector : 시간의 구간을 가지는 데이터 타입
        • 시간 단위 : ms, s, m(주로 분 사용), h, d, w, y
      # 시점 데이터
      node_cpu_seconds_total
      
      # 15초 마다 수집하니 아래는 지난 4회차/8회차의 값 출력
      node_cpu_seconds_total[1m]
      node_cpu_seconds_total[2m]
    • 활용
      # 서비스 정보 >> 네임스페이스별 >> cluster_ip 별
      kube_service_info
      count(kube_service_info)
      count(kube_service_info) by (namespace)
      count(kube_service_info) by (cluster_ip)
      
      # 컨테이너가 사용 메모리 -> 파드별
      container_memory_working_set_bytes
      sum(container_memory_working_set_bytes)
      sum(container_memory_working_set_bytes) by (pod)
      topk(5,sum(container_memory_working_set_bytes) by (pod))
      topk(5,sum(container_memory_working_set_bytes) by (pod))/1024/1024


    4.9. 다른 time series db


    1. Grafana5.1. Grafana 소개: TSDB 데이터를 시각화, 다양한 데이터 형식 지원(메트릭, 로그, 트레이스 등) - Docs , Blog , Toturials ,
      • Grafana open source software enables you to query, visualize, alert on, and explore your metrics, logs, and traces wherever they are stored.
        • Grafana OSS provides you with tools to turn your time-series database (TSDB) data into insightful graphs and visualizations.
      • 그라파나는 시각화 솔루션으로 데이터 자체를 저장하지 않음 → 현재 실습 환경에서는 데이터 소스프로메테우스를 사용
      • 접속 정보 확인 및 로그인 : 기본 계정 - admin / prom-operator
      # 그라파나 버전 확인
      kubectl exec -it -n monitoring sts/kube-prometheus-stack-grafana -- grafana cli --version
      grafana cli version 11.5.1
      
      # ingress 확인
      kubectl get ingress -n monitoring kube-prometheus-stack-grafana
      kubectl describe ingress -n monitoring kube-prometheus-stack-grafana
      
      # ingress 도메인으로 웹 접속 : 기본 계정 - admin / prom-operator
      echo -e "Grafana Web URL = https://grafana.$MyDomain"
      • 우측 상단 : admin 사용자의 개인 설정
      • 기본 대시보드 확인
        1. Search dashboards : 대시보드 검색
        1. Starred : 즐겨찾기 대시보드
        1. Dashboards : 대시보드 전체 목록 확인
        1. Explore : 쿼리 언어 PromQL를 이용해 메트릭 정보를 그래프 형태로 탐색
        1. Alerting : 경고, 에러 발생 시 사용자에게 경고를 전달
        1. Connections : 설정, 예) 데이터 소스 설정 등
        1. Administartor : 사용자, 조직, 플러그인 등 설정
      • Connections → Your connections : 스택의 경우 자동으로 프로메테우스를 데이터 소스로 추가해둠 ← 서비스 주소 확인
        # 서비스 주소 확인
        kubectl get svc,ep -n monitoring kube-prometheus-stack-prometheus
        NAME                                       TYPE        CLUSTER-IP     EXTERNAL-IP   PORT(S)    AGE
        service/kube-prometheus-stack-prometheus   ClusterIP   10.100.143.5   <none>        9090/TCP   21m
        
        NAME                                         ENDPOINTS           AGE
        endpoints/kube-prometheus-stack-prometheus   192.168.2.93:9090   21m
        • 해당 데이터 소스 접속 확인
        # 테스트용 파드 배포
        cat <<EOF | kubectl create -f -
        apiVersion: v1
        kind: Pod
        metadata:
          name: netshoot-pod
        spec:
          containers:
          - name: netshoot-pod
            image: nicolaka/netshoot
            command: ["tail"]
            args: ["-f", "/dev/null"]
          terminationGracePeriodSeconds: 0
        EOF
        kubectl get pod netshoot-pod
        
        # 접속 확인
        kubectl exec -it netshoot-pod -- nslookup kube-prometheus-stack-prometheus.monitoring
        kubectl exec -it netshoot-pod -- curl -s kube-prometheus-stack-prometheus.monitoring:9090/graph -v ; echo
        
        # 삭제
        kubectl delete pod netshoot-pod
      5.2. 대시보드 사용 : 기본 대시보드와 공식 대시보드 가져오기
      • 스택을 통해서 설치된 기본 대시보드 확인 : Dashboards → Browse
      • (대략) 분류 : 자원 사용량 - Cluster/POD Resources, 노드 자원 사용량 - Node Exporter, 주요 애플리케이션 - CoreDNS 등
        • 확인해보자 - K8S / CR / Cluster, Node Exporter / Use Method / Cluster

      • [Kubernetes / Views / Global] Dashboard → New → Import → 15757 력입력 후 Load ⇒ 데이터소스(Prometheus 선택) 후 Import 클릭
      • [1 Kubernetes All-in-one Cluster Monitoring KR] Dashboard → New → Import → 17900 입력 후 Load ⇒ 데이터소스(Prometheus 선택) 후 Import 클릭
        아래 값 출력되게 수정해보자!
        • 해당 패널에서 Edit → 아래 수정 쿼리 입력 후 Run queries 클릭 → 상단 SaveApply
          sum by (node) (irate(node_cpu_seconds_total{mode!~"guest.*|idle|iowait", node="$node"}[5m]))
          node_cpu_seconds_total
          node_cpu_seconds_total{mode!~"guest.*|idle|iowait"}
          avg(node_cpu_seconds_total{mode!~"guest.*|idle|iowait"}) by (node)
          avg(node_cpu_seconds_total{mode!~"guest.*|idle|iowait"}) by (instance)
          sum by (instance) (irate(node_cpu_seconds_total{mode!~"guest.*|idle|iowait"}[5m]))
          
          # 수정
          sum by (instance) (irate(node_cpu_seconds_total{mode!~"guest.*|idle|iowait", instance="$instance"}[5m]))
          # 수정 : 메모리 점유율
          (node_memory_MemTotal_bytes{instance="$instance"}-node_memory_MemAvailable_bytes{instance="$instance"})/node_memory_MemTotal_bytes{instance="$instance"}
          
          # 수정 : 디스크 사용률
          sum(node_filesystem_size_bytes{instance="$instance"} - node_filesystem_avail_bytes{instance="$instance"}) by (instance) / sum(node_filesystem_size_bytes{instance="$instance"}) by (instance)
        상단 네임스페이스와 파드 정보 필터링 출력되게 수정해보자!
        • 오른쪽 상단 Edit → Settings → Variables 아래 namesapce, pod 값 수정 ⇒ 수정 후 Save dashboard 클릭
          • namespace 경우 : kube_pod_info 로 수정
          • namespace 오른쪽 show usages 클릭 시 → 맨 하단에 pod variable 가 namespace 를 하위에 종속? 관계 확인
        파드의 리소스 할당 제한 제대로 표시 해보자!
        • 리소스 할당 제한 패널 edit → Save dashboard
          • CPU
            
            # 기존
            sum(kube_pod_container_resource_limits_cpu_cores{pod="$pod"})
            
            # 변경 전 쿼리 시도
            kube_pod_container_resource_limits_cpu_cores
            kube_pod_container_resource_limits
            kube_pod_container_resource_limits{resource="cpu"}
            
            # 변경
            sum(kube_pod_container_resource_limits{resource="cpu", pod="$pod"})
          • Memory
            # 기존
            sum(kube_pod_container_resource_limits_memory_bytes{pod="$pod"})
            
            # 변경
            sum(kube_pod_container_resource_limits{resource="memory", pod="$pod"})
        • default 네임스페이스에 nginx 파드 정보 확인 : 쿼리 수정 후 바로 적용 안되니, 파드를 선택 후 재선택 하자..
      •  
      • [Node Exporter Full] Dashboard → New → Import → 1860 입력 후 Load ⇒ 데이터소스(Prometheus 선택) 후 Import 클릭
      • [Node Exporter for Prometheus Dashboard based on 11074] 15172
      • kube-state-metrics-v2 가져와보자 : Dashboard ID copied! (13332) 클릭 - 링크
        • [kube-state-metrics-v2] Dashboard → New → Import → 13332 입력 후 Load ⇒ 데이터소스(Prometheus 선택) 후 Import 클릭
      • [Amazon EKS] AWS CNI Metrics 16032 - 링크
        # PodMonitor 배포
        cat <<EOF | kubectl create -f -
        apiVersion: monitoring.coreos.com/v1
        kind: PodMonitor
        metadata:
          name: aws-cni-metrics
          namespace: kube-system
        spec:
          jobLabel: k8s-app
          namespaceSelector:
            matchNames:
            - kube-system
          podMetricsEndpoints:
          - interval: 30s
            path: /metrics
            port: metrics
          selector:
            matchLabels:
              k8s-app: aws-node
        EOF
        
        # PodMonitor 확인
        kubectl get podmonitor -n kube-system
    2. 공식 대시보드 가져오기 - 링크 추천
    3. 기본 대시보드

    5.3. NGINX 애플리케이션 모니터링 대시보드 추가

    • 그라파나에 12708 대시보드 추가 - Link
    # scale out
    kubectl scale deployment nginx --replicas 9
    
    # ngnix_up에서 variable을 통해서 node별 pod 확인는 query
    count(
      nginx_up{job="nginx", container="metrics"}
      * on(pod) group_left(node)
      kube_pod_info
    ) by (node)

    5.4. [중급] Panel 패널 - Link

    https://grafana.com/docs/grafana/latest/panels-visualizations/visualizations/

    • Graphs & charts
      • Time series is the default and main Graph visualization.
      • Histogram calculates and shows value distribution in a bar chart.
      • Heatmap visualizes data in two dimensions, used typically for the magnitude of a phenomenon.
      • Pie chart is typically used where proportionality is important.
      • Candlestick is typically for financial data where the focus is price/data movement.
      • Gauge is the traditional rounded visual showing how far a single metric is from a threshold.
    • Stats & numbers
      • Stat for big stats and optional sparkline.
      • Bar gauge is a horizontal or vertical bar gauge.
    • Misc
      • Table is the main and only table visualization.
      • Logs is the main visualization for logs.
      • Traces is the main visualization for traces.
      • Flame graph is the main visualization for profiling.
      • Canvas allows you to explicitly place elements within static and dynamic layouts.
      • Geomap helps you visualize geospatial data.


    • 실습 준비 : 신규 대시보스 생성 → 패널 생성(Code 로 변경) → 쿼리 입력 후 Run queries 클릭 후 오른쪽 상단 Apply 클릭 → 대시보드 상단 저장
    1. Time series : 아래 쿼리 입력 후 오른쪽 입력 → Title(노드별 5분간 CPU 사용 변화율)
      node_cpu_seconds_total
      rate(node_cpu_seconds_total[5m])
      sum(rate(node_cpu_seconds_total[5m]))
      sum(rate(node_cpu_seconds_total[5m])) by (instance)
      • 상단 : 최근 30분, 5초 간격 Auto 쿼리
    1. Bar chart : Add → Visualization 오른쪽(Bar chart) ⇒ 쿼리 Options : Legend(Auto), Format(Table), Type(Instance) → Title(네임스페이스 별 디플로이먼트 갯수)
      kube_deployment_status_replicas_available
      count(kube_deployment_status_replicas_available) by (namespace)
    1. Stat : Add → Visualization 오른쪽(Stat) → Title(nginx 파드 수)
      kube_deployment_spec_replicas
      kube_deployment_spec_replicas{deployment="nginx"}
      
      # scale out
      kubectl scale deployment nginx --replicas 6
    1. Gauge : Add → Visualization 오른쪽(Gauge) → Title(노드 별 1분간 CPU 사용률)
      node_cpu_seconds_total
      node_cpu_seconds_total{mode="idle"}
      node_cpu_seconds_total{mode="idle"}[1m]
      rate(node_cpu_seconds_total{mode="idle"}[1m])
      avg(rate(node_cpu_seconds_total{mode="idle"}[1m])) by (instance)
      1 - (avg(rate(node_cpu_seconds_total{mode="idle"}[1m])) by (instance))
    1. Table : Add → Visualization 오른쪽(Table) ⇒ 쿼리 Options : Format(Table), Type(Instance) → Title(노드 OS 정보)
      node_os_info
      • Transform data → Organize fields by name : id_like, instance, name, pretty_name
    1. 원하는 위치로 배치
    1. [도전] 대시보드에 Variables 에 instance 를 설정 후 필터링 출력 되게 해보자!
      • Dashboard > [MY_DASHBOARD] > Settings > Variable
        • Name: instance
        • Label: instance
        • Query options
          • Data source: prometheus
          • Query
            • Query type: Label values
            • Label: instance
            • Metric: node_os_info
        • Selection options: Multi-value, Allow custom values, Include All option enable
      # Node OS 정보
      node_os_info{instance=~"$instance"}
      
      # 노드별 5분간 CPU 사용 변화율
      sum(rate(node_cpu_seconds_total{instance=~"$instance"}[5m]) ) by (instance)

    6. Grafana Alert

    • 그라파나 9.4 버전이 2월 28일 출시 - 링크Alerting 기능이 강화되었고, 이미지 알람 기능도 제공 - 링크
    • 그라파나 9.5 버전이 Alerting 기능 업데이트 - 링크6.1. 그라파나 얼럿 Docs - 링크 Workshop Blog1 Blog2
      1. Contact points → Add contact point 클릭
        • Integration : 슬랙
        • Webhook URL : 아래 주소 입력
          https://hooks.slack.com/services/SOME_WEBHOOK_URL
        • Optional Slack settings → Username : 메시지 구분을 위해서 각자 자신의 닉네임 입력
        • 오른쪽 상단 : Test 해보고 저장
      1. Notification policies : 기본 정책 수정 Edit - Default contact point(slack)
      1. 그라파나 → Alerting → Alert ruels → Create alert rule : Name(nginx alert) - nginx 웹 요청 1분 동안 누적 600 이상 시 Alert 설정
        • 아래 Folder 과 Evaluation group(1m), Pending period(1m) 은 +Add new 클릭 후 신규로 만들어 주자
        • Configure notifications : Contack point(slack)
        ⇒ 오른쪽 상단 Save and exit 클릭
      2.  
      4.nginx 반복 접속 실행 후 슬랙 채널 알람 확인
      while true; do curl -s https://nginx.$MyDomain -I | head -n 1; date; done
      1. 메트릭 이미지 포함 알람 : 그라파나 이미지를 포함한 슬랙 얼럿 설정 - 링크 & Grafana - Image Render Plugin & Slack Alert 연동 - 링크
    • https://grafana.com/docs/grafana/latest/alerting/


Designed by Tistory.